Executive Summary
The chicken-and-egg problem in two-sided digital marketplaces is fundamentally a coordination failure rooted in indirect network effects, not a marketing or execution challenge. It arises when user value on each side depends entirely on the presence of the other side, creating a mathematical condition where both sides rationally remain at zero participation despite potential gains from trade.
Five findings from empirical research:
-
The problem is mathematically structural. Indirect network effects mean user utility increases with opposite-side participation: . At cold start (), utility equals baseline brand value (), which is negligible for new platforms. No marketing overcomes this; only external supply/demand injection can.
-
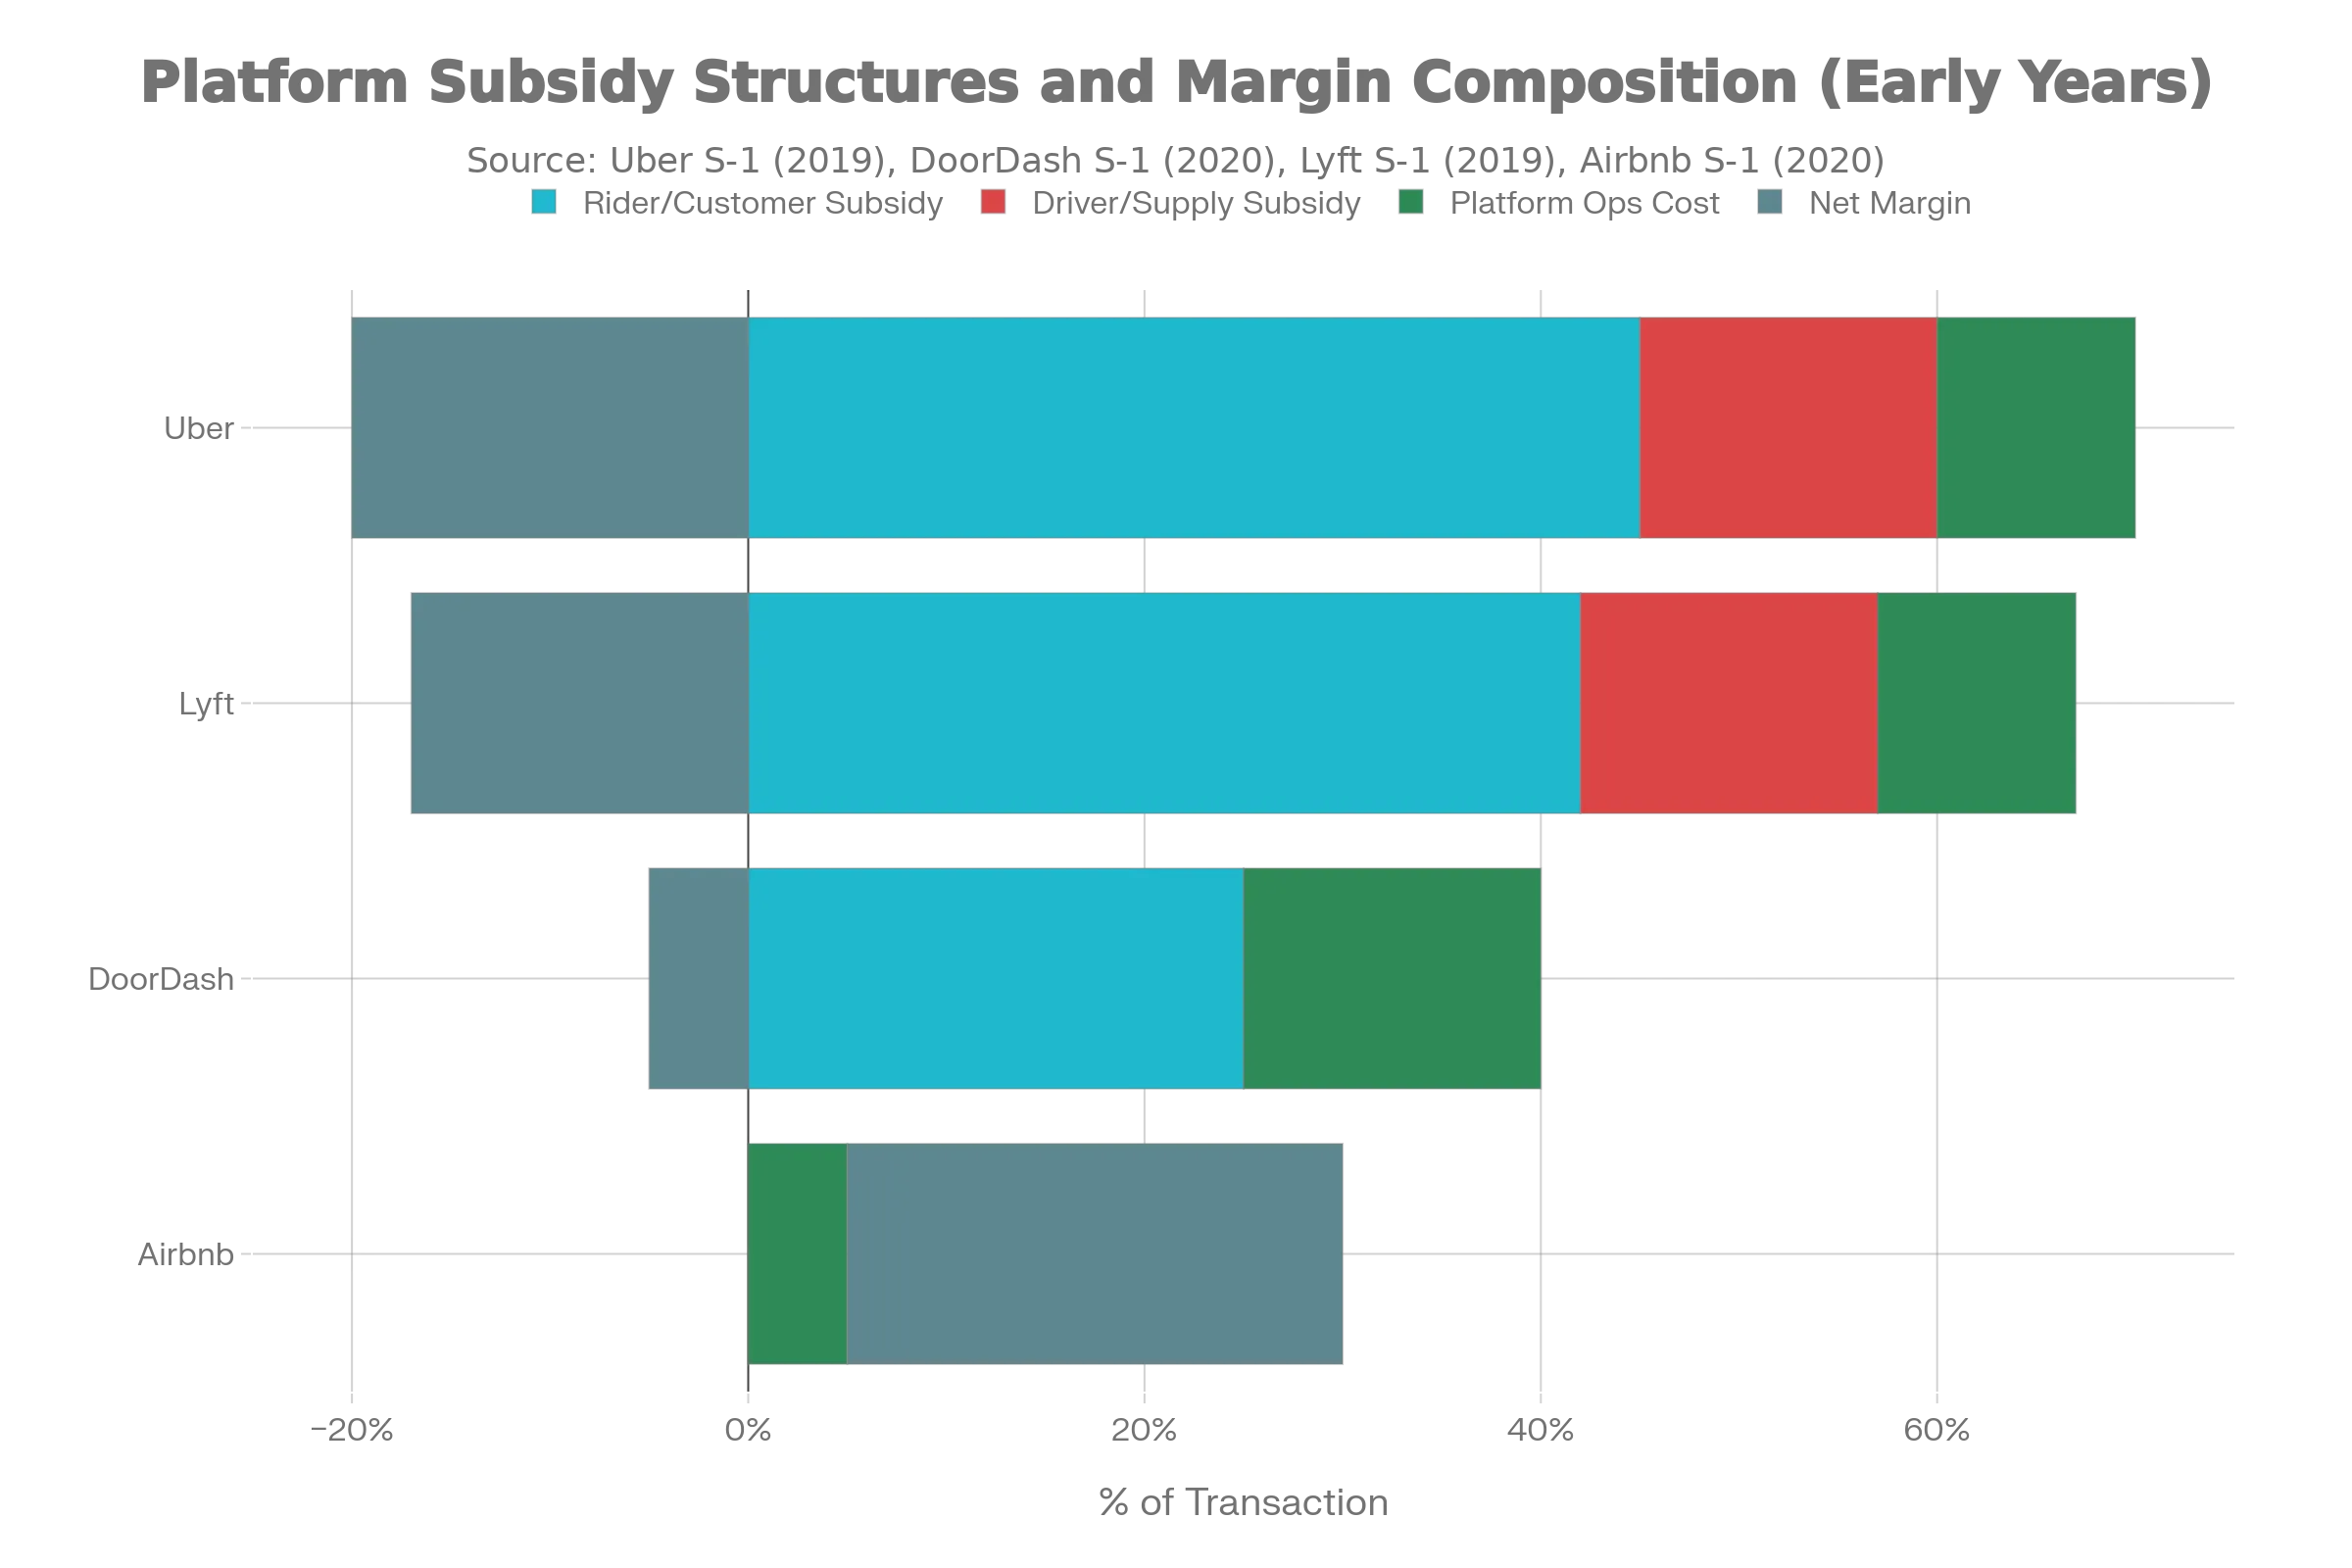
Successful platforms purchased liquidity, not earned it. Uber subsidized 59% of rider trip costs (2015); DoorDash accepted 0% contribution margin for 12+ months; Airbnb relied on highly elastic host supply in high-demand geographies. None achieved organic adoption at scale.
-
Traditional SaaS unit economics are invalid. LTV > CAC assumes constant user margin (). In marketplaces, margin is a function of network density: . At cold start, margin approaches zero regardless of cohort quality, making early CAC irrational under standard financial models.
-
Market structure determines feasibility. High supply elasticity (gig labor, casual hosting) + high demand density (major cities) = tractable cold start in 2-4 years. Low elasticity + low density = likely unsolvable without fundamental repositioning. Most platforms cannot overcome this constraint through capital alone.
-
Profitability timelines extend far beyond conventional venture expectations. DoorDash required 2-3 years to recover CAC per cohort. Uber remained unprofitable in most markets for 7+ years. This creates a capital sustainability gap for platforms lacking multi-billion-dollar funding access.
Implication for platform builders: Before committing capital, conduct a structural diagnostic on supply elasticity and demand density. If both are low, the chicken-and-egg problem is likely unsolvable. Consider alternative business models or markets.
1. Indirect Network Effects and the Zero-Adoption Equilibrium
1.1 What Distinguishes Two-Sided Marketplaces from Traditional Platforms
A two-sided marketplace enables transactions between two distinct user groups (riders and drivers, guests and hosts, consumers and restaurants). Unlike single-sided platforms (search engines, social networks) where value accrues to a single user group, marketplace value is interaction-dependent: it exists only when both sides participate.
This creates indirect network effects—the canonical economic structure governing two-sided platforms. Formally:
where:
- : utility for a typical user on side
- : baseline utility (brand value, product features independent of network)
- : strength of cross-side network effect (how much each user on side increases utility for side )
- : number of active users on the opposite side
Critical distinction: Unlike same-side network effects (where more users increase utility for all users on that side), indirect effects are asymmetric: they depend on a different side. This asymmetry creates the cold-start problem.
1.2 The Zero-Adoption Equilibrium: Mathematical Formulation
A rational user adopts a platform if and only if:
where is the user’s adoption threshold (alternative value, switching costs, etc.).
At cold start, when both and :
Both inequality constraints bind. Neither side joins. The market equilibrium is a zero-participation trap—not because the platform lacks potential value, but because that value cannot materialize without coordination.
This is a Schelling coordination failure. A “good equilibrium” exists at high and , but decentralized rational choice cannot reach it. Users expect others not to join, so they don’t join. Expectations become self-fulfilling.
Critical implication: This is not a problem marketing or product optimization can solve. The barrier is structural: math, not messaging.
2.Five Interconnected Constraints
Cold start is driven not by a single factor but by an interconnected system of five structural constraints. Understanding each is necessary to diagnose why standard acquisition strategies fail.
2.1 Liquidity Thresholds and the Match Probability Barrier
Definition: A marketplace achieves operational liquidity when the expected surplus from participation exceeds search and friction costs for a typical user.
Formally, a user’s expected payoff from joining is:
where:
- : probability of achieving a successful match within an acceptable timeframe
- : average value of a successful match
- : cognitive and time cost of browsing/selecting
- : onboarding, payment, verification friction
- : opportunity cost of waiting time
A user rationally joins when:
Rearranging for the critical match probability threshold:
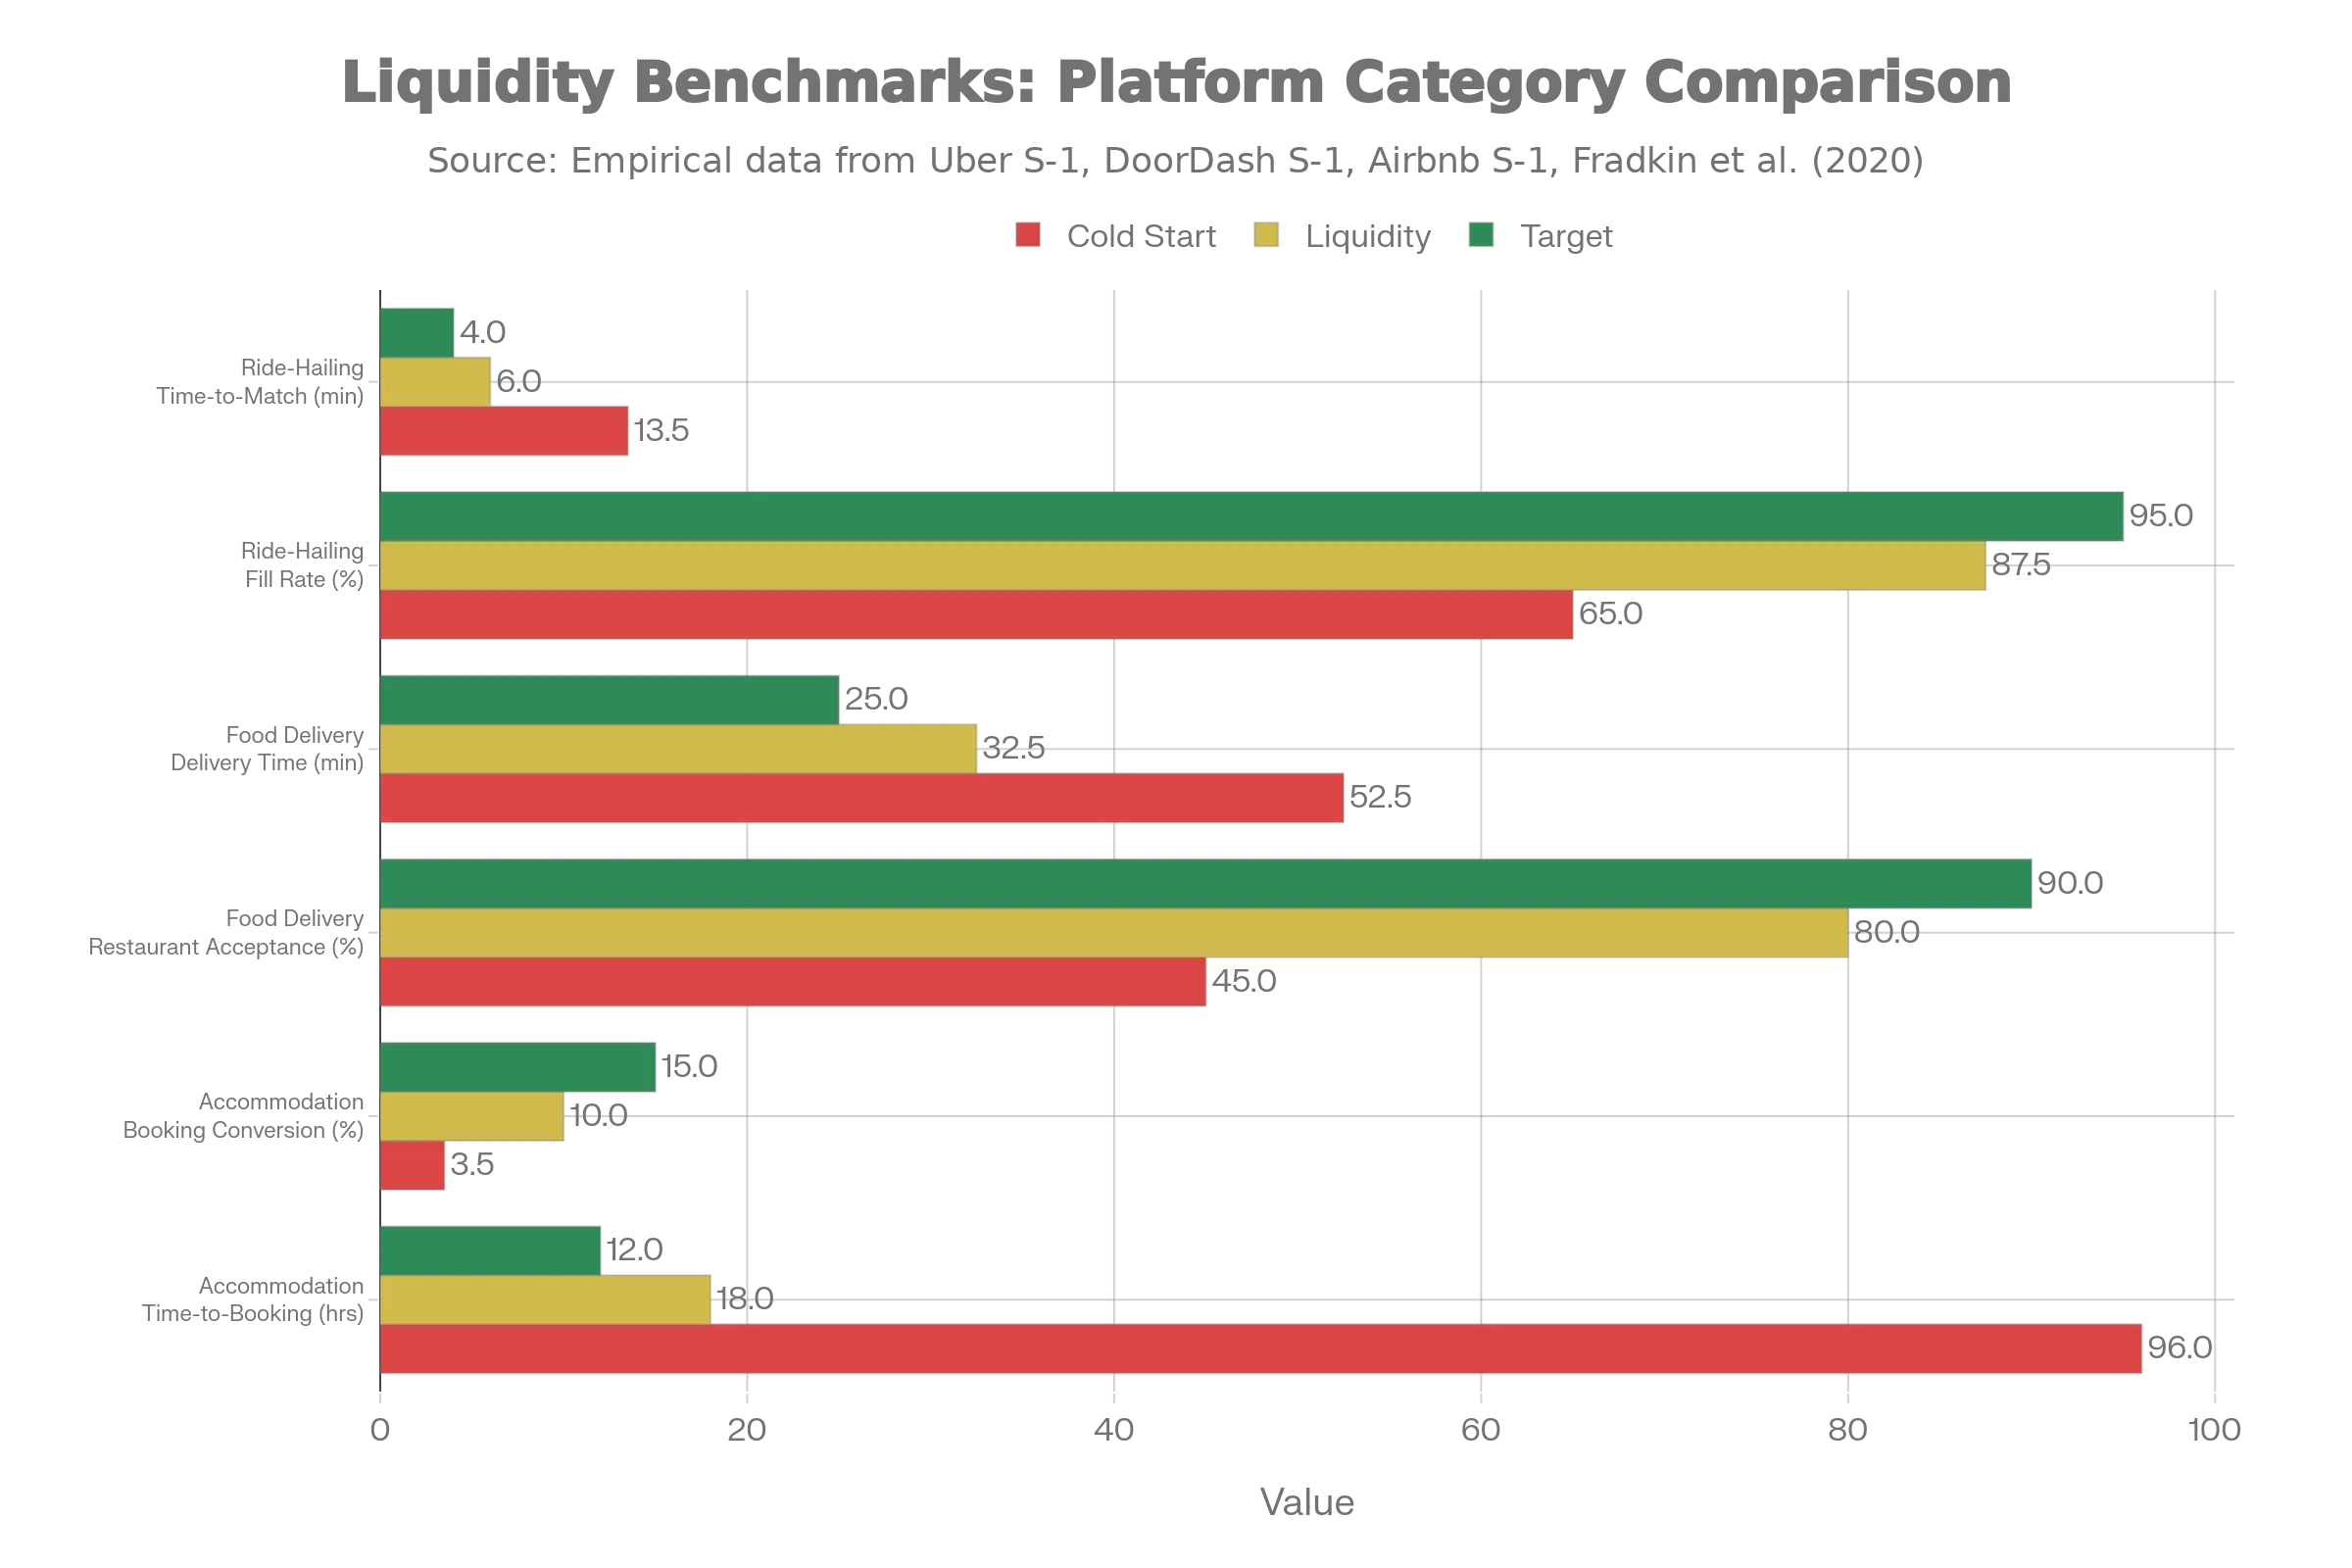
Empirical benchmarks from platform data:
| Platform | Metric | Cold Start | Liquidity | Target |
|---|---|---|---|---|
| Ride-hailing | Time-to-match | 12-15 min | 5-7 min | < 4 min |
| Ride-hailing | Fill rate (fulfillment %) | 60-70% | 85-90% | > 95% |
| Food delivery | Avg delivery time | 45-60 min | 30-35 min | < 25 min |
| Food delivery | Restaurant acceptance rate | 40-50% | 75-85% | > 90% |
| Accommodation | Booking conversion | 2-5% | 8-12% | 15%+ |
| Accommodation | Avg time-to-booking | 3-5 days | 12-24 hrs | < 12 hrs |
Strategic implication: Cold start is fundamentally a liquidity problem, not a user acquisition problem. Spending on customer acquisition before exceeds threshold simply accelerates churn. The metrics above define the minimum viable liquidity state before scaled marketing makes financial sense.
2.2 Trust, Information Asymmetry, and the Lemons Problem
Early marketplaces lack transactional history. Without reviews, completion data, ratings, or identity verification, severe information asymmetry emerges. Akerlof’s “market for lemons” (1970) directly applies.
The dynamic:
- Buyers assume low quality (no data to distinguish high from low quality).
- Buyers offer low prices (risk-adjusted for low expected quality).
- High-quality sellers exit (prices do not cover their costs).
- Equilibrium degrades (only low-quality sellers remain).
Empirical evidence from platform launches:
-
Airbnb (2008-2010): Early listings had blurry photos, inconsistent pricing, and unverified hosts. Guests were worried about getting ripped off. Booking conversion was around 2-3%, jumping to 12-15% by 2012 after reviews and verification launched.
-
Uber (2009-2011): Early drivers were hit or miss - some had beat-up cars, got you lost, or weren’t professional. Rider churn in the first two weeks was brutal at 40%. Once they added driver ratings and background checks (2011), retention improved to 25-30% churn.
Cost of trust infrastructure: Platform operators must invest in verification, insurance, dispute resolution, and guarantee mechanisms before meaningful adoption occurs. These are not optional marketing expenses; they are structural prerequisites for liquidity.
Estimated pre-liquidity costs:
- Background checks/KYC: $2-10 per user, amortized
- Insurance and liability frameworks: 2-5% of GMV
- Dispute resolution/customer support: 3-8% of GMV in early stages
Strategic implication: Don’t underestimate the cost of building trust. Plan to spend 10-20% of early funding on verification, insurance, and fraud prevention. Without it, you won’t hit liquidity thresholds.
2.3 Supply Elasticity: The Structural Advantage
The speed at which supply responds to demand incentives is a first-order determinant of cold-start tractability.
Definition: Supply elasticity measures the percentage change in supply quantity in response to a 1% change in price/incentive:
Empirical elasticity estimates from research:
| Supply Type | Context | Short-Run Elasticity | Long-Run Elasticity |
|---|---|---|---|
| Airbnb hosts | Urban, high-demand cities | 0.8-1.2 (elastic) | 1.5-2.0 (highly elastic) |
| Rideshare drivers | Peak hours, urban | 0.6-0.9 (moderately elastic) | 1.1-1.4 (elastic) |
| Food delivery dashers | Urban, peak times | 0.7-1.1 (elastic) | 1.2-1.6 (elastic) |
| Enterprise B2B services | Specialized consultants | 0.1-0.3 (inelastic) | 0.2-0.5 (inelastic) |
| Licensed professionals | Doctors, lawyers, therapists | 0.05-0.15 (highly inelastic) | 0.1-0.3 (inelastic) |
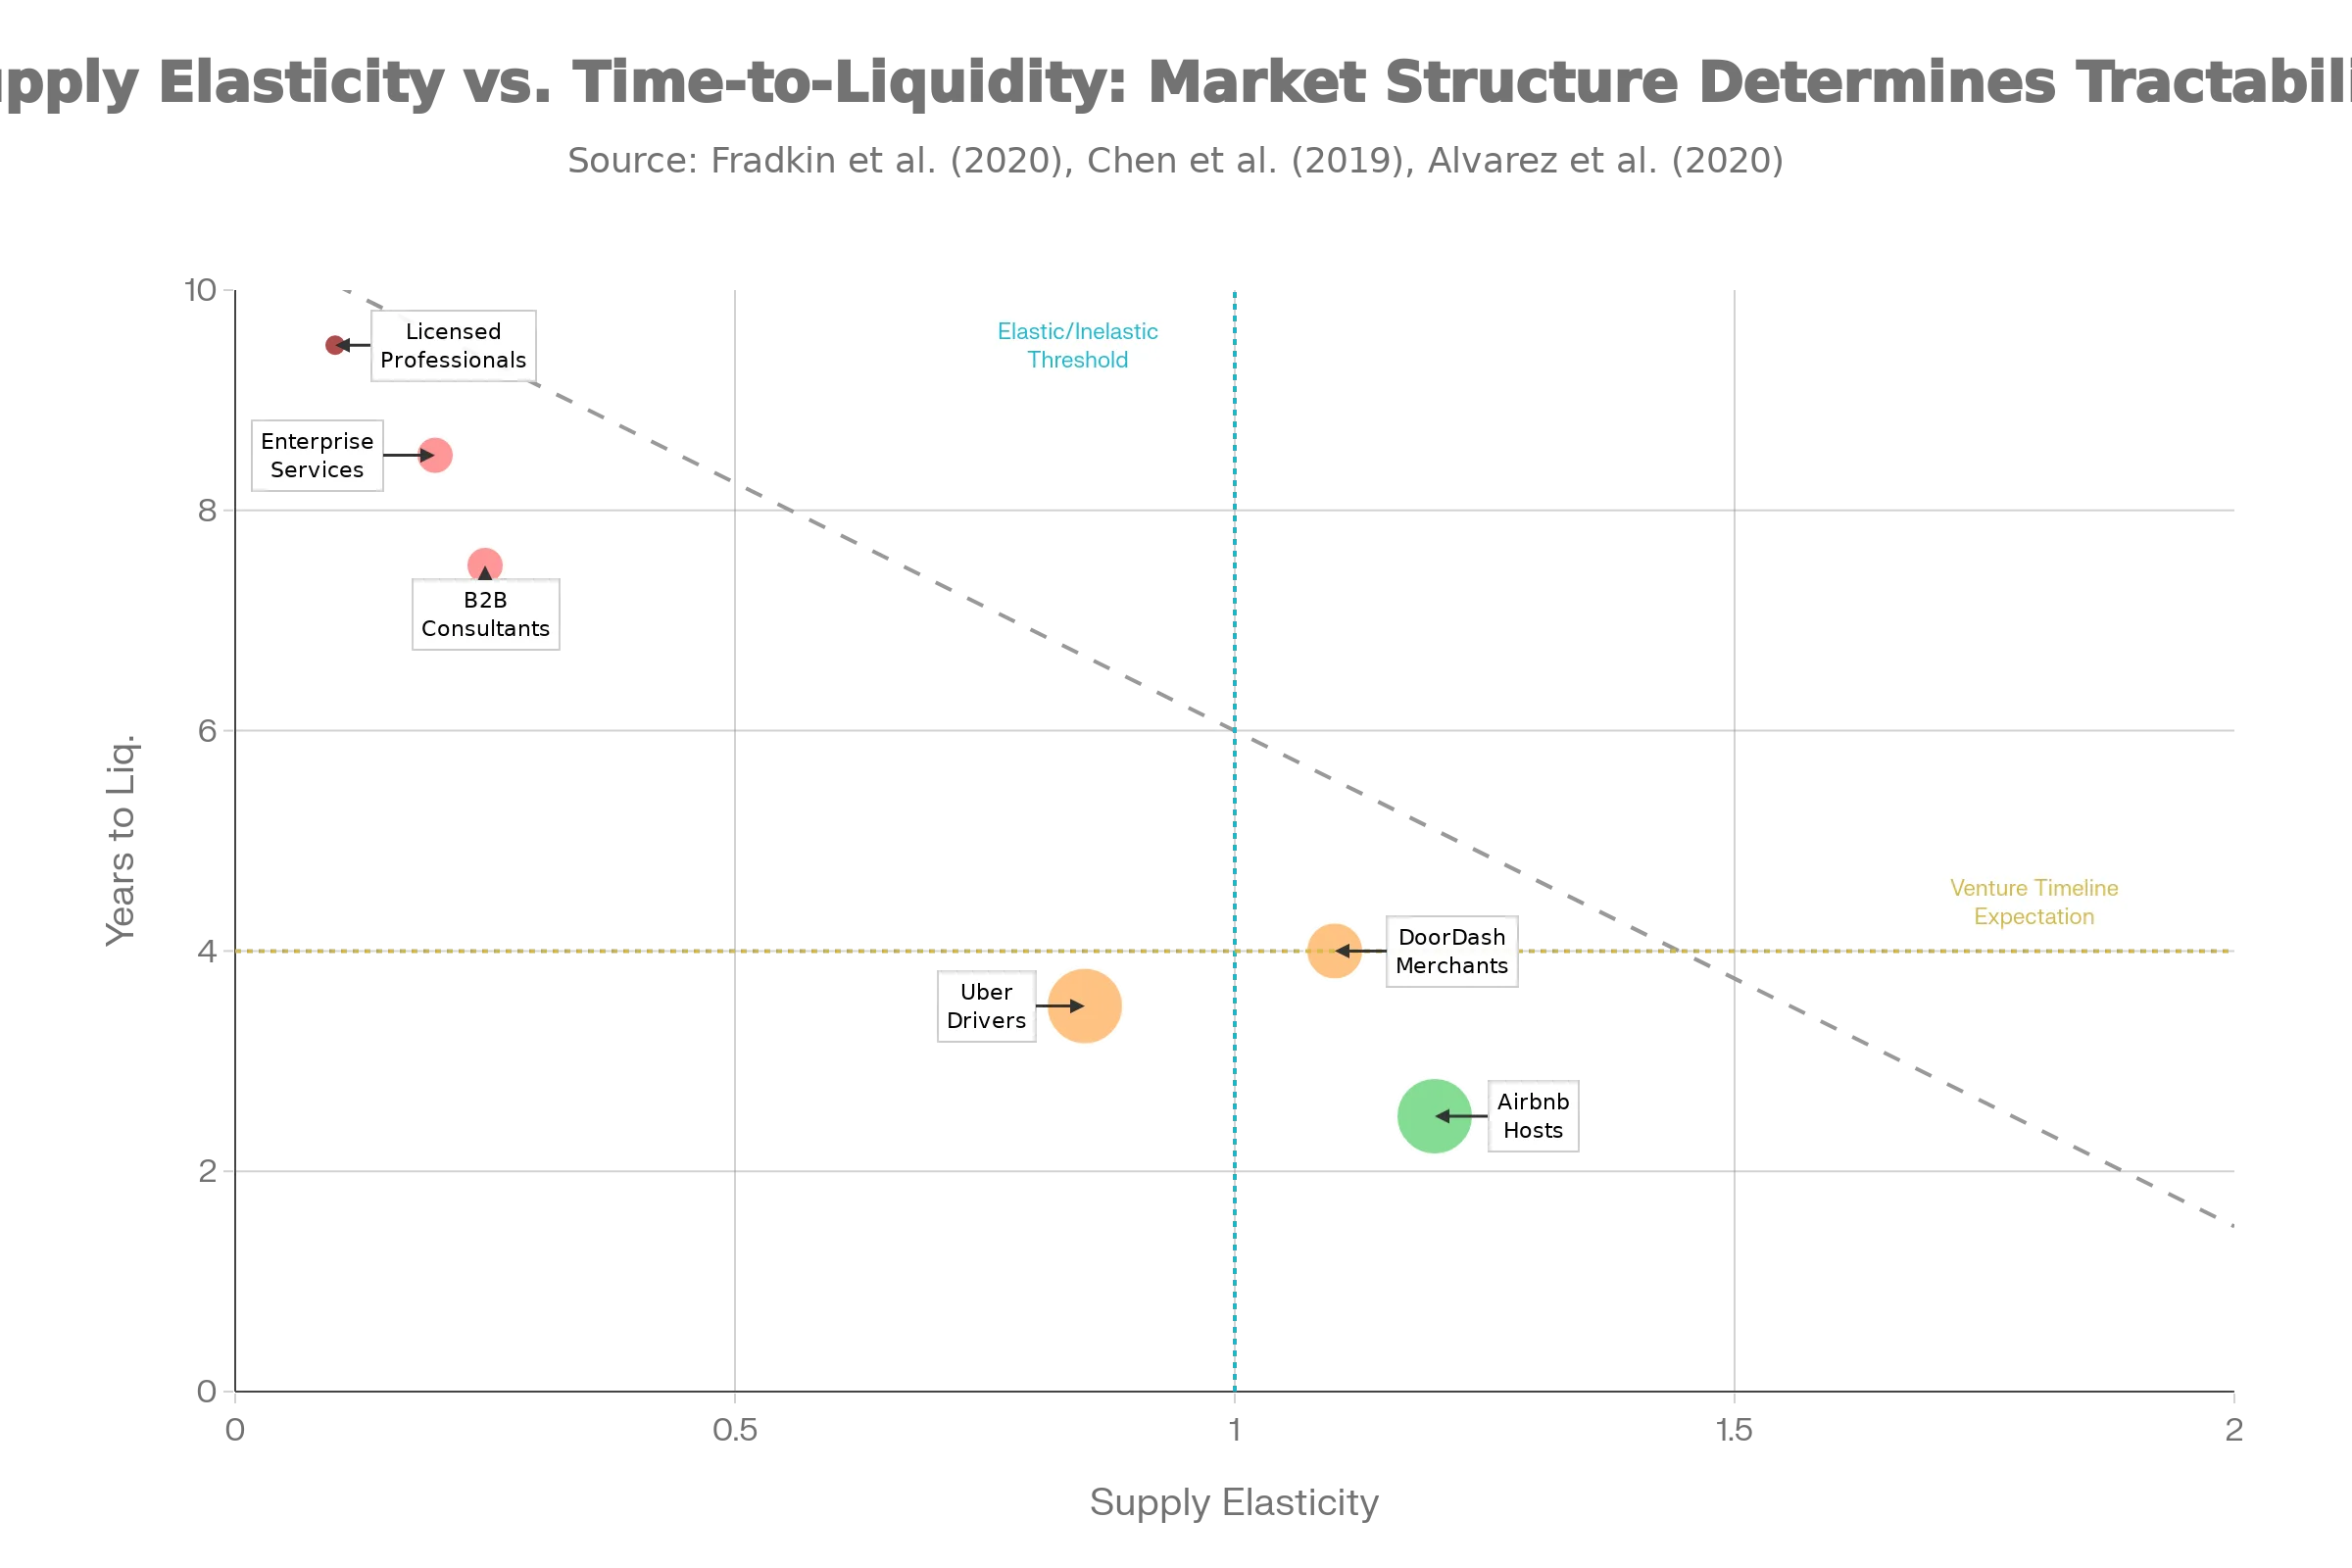
Key insight: High elasticity is a structural asset for cold start. Once demand density reaches a threshold, supply floods in. Low elasticity means supply remains constrained, prices stay high, and margins remain elevated indefinitely.
Strategic implication: Choose markets with high supply elasticity, or accept that your marketplace will be supply-constrained and high-margin permanently. This is not a scalability problem; it is a feature of the market structure.
2.4 Subsidy Efficiency and Cross-Side Elasticity Misalignment
Platforms must choose which side to subsidize and by how much. This choice determines cold-start efficiency and long-term profitability.
Optimal subsidy structure:
Platforms should subsidize the side with:
- Higher price sensitivity (more elastic demand for lower prices)
- Lower switching costs (easier to acquire and retain)
- Lower growth friction (faster onboarding, lower CAC)
Typically, this is the demand side. Supply sides are charged higher take rates to offset demand subsidies.
Empirical subsidy structures:
| Platform | Demand-Side Subsidy | Supply-Side Subsidy | Take Rate (Supply) | Period |
|---|---|---|---|---|
| Uber (US) | 41-50% of trip cost | Driver earning guarantees | 20-25% | 2014-2017 |
| Lyft (US) | 40-45% of trip cost | Driver sign-up bonuses, ride bonuses | 25% | 2014-2017 |
| DoorDash | Free/discounted delivery, discounts | Restaurant commission waivers | 15-30% | 2013-2019 |
| Airbnb | No direct subsidy | None | 3% host fee | 2008-2012 |
Problem of misaligned subsidies: Yao et al. (2019, field experiments in rideshare) show that flat driver subsidies applied uniformly often increase cost more than they increase durable supply, especially when cross-side elasticity is misestimated.
Strategic implication: Before subsidizing, estimate cross-side elasticity in your specific market. A 10% error in elasticity estimates can double your capital requirements to reach liquidity threshold.
2.5 Complementary Network Dependencies and Spillover Effects
Liquidity in one marketplace can depend critically on liquidity in other, external platforms you do not control.
Case in point: Airbnb’s Austin disruption (2015-2016).
When Uber and Lyft exited Austin (2015) due to regulatory pressure, Airbnb experienced measurable spillover damage:
- Airbnb supply dropped 4.5%
- Nightly rates fell $9.30
- Booking conversion fell from 11% to 8%
Why? Guests cannot easily reach Airbnb properties without rideshare. If transportation is unavailable, the utility of booking an Airbnb falls below the adoption threshold, even for guests already on the platform.
Strategic implication: Map your complementary platform dependencies. If your marketplace sits in a larger ecosystem (e.g., e-commerce platform depending on payment platforms, delivery platforms depending on transportation), model the risk of external shocks.
3.How Dominant Platforms Actually Crossed the Liquidity Threshold
The empirical record is unambiguous: successful platforms purchased liquidity, not earned it. They employed capital-intensive strategies that violated traditional unit economics models but were rational given the structural chicken-and-egg constraint.
3.1 Airbnb: High Supply Elasticity as a Force Multiplier
Timeline: Founded 2008. Liquidity achieved in San Francisco by 2010; national scale by 2013.
Capital strategy: Minimal direct subsidies. Instead:
- Manual supply seeding (founders listing their own apartments, recruiting early hosts)
- Focus on high-demand geographies (San Francisco, New York, Paris—cities with high tourist density and income)
- Leverage host supply elasticity
Empirical outcomes:
- Consumer surplus per room-night: $41
- Host surplus per room-night: $26
- Total surplus created: $67 per room-night
- Host supply elasticity (short-run): 0.8-1.2; (long-run): 1.5-2.0
- Host booking conversion: improved from 2-3% (2008-2009) to 12-15% (2012)
Cost structure:
- Minimal demand-side subsidies (no free nights, no discounts in early phase)
- Relied on word-of-mouth and PR (low CAC)
- Heavy operations cost in supply recruitment and curation (estimated 5-10% of early revenue)
Key insight: Airbnb succeeded not through cheaper capital but through choosing a market where supply was highly elastic. Once demand density reached critical mass, hosts flooded in, compressing the cold-start phase.
Strategic lesson: High elasticity is worth more than capital. Choose your market based on elasticity, not just market size.
3.2 Uber: Purchased Liquidity Through Massive Cross-Subsidies
Timeline: Founded 2009. Achieved city-level liquidity in SF by 2011; national scale by 2015.
Capital strategy: Aggressive, concurrent subsidization of both sides.
Empirical subsidy magnitude:
- Riders paid ~41% of actual trip costs in 2015
- The remaining 59% was covered by VC-funded subsidies
- Driver earning guarantees added another 10-15% to supply-side subsidy
- Total subsidy: ~70% of platform transaction value in early years
Evidence of fragility: When subsidies were tested:
- Field experiment: A 2x surge in pricing reduced rider requests by ~40%
- India expansion: When Uber reduced driver incentives to test profitability, driver supply collapsed within weeks, and service availability fell from 8-minute average match time to 20+ minutes
- Long-term profitability: Uber remained unprofitable in most markets through 2018, despite billions in revenue
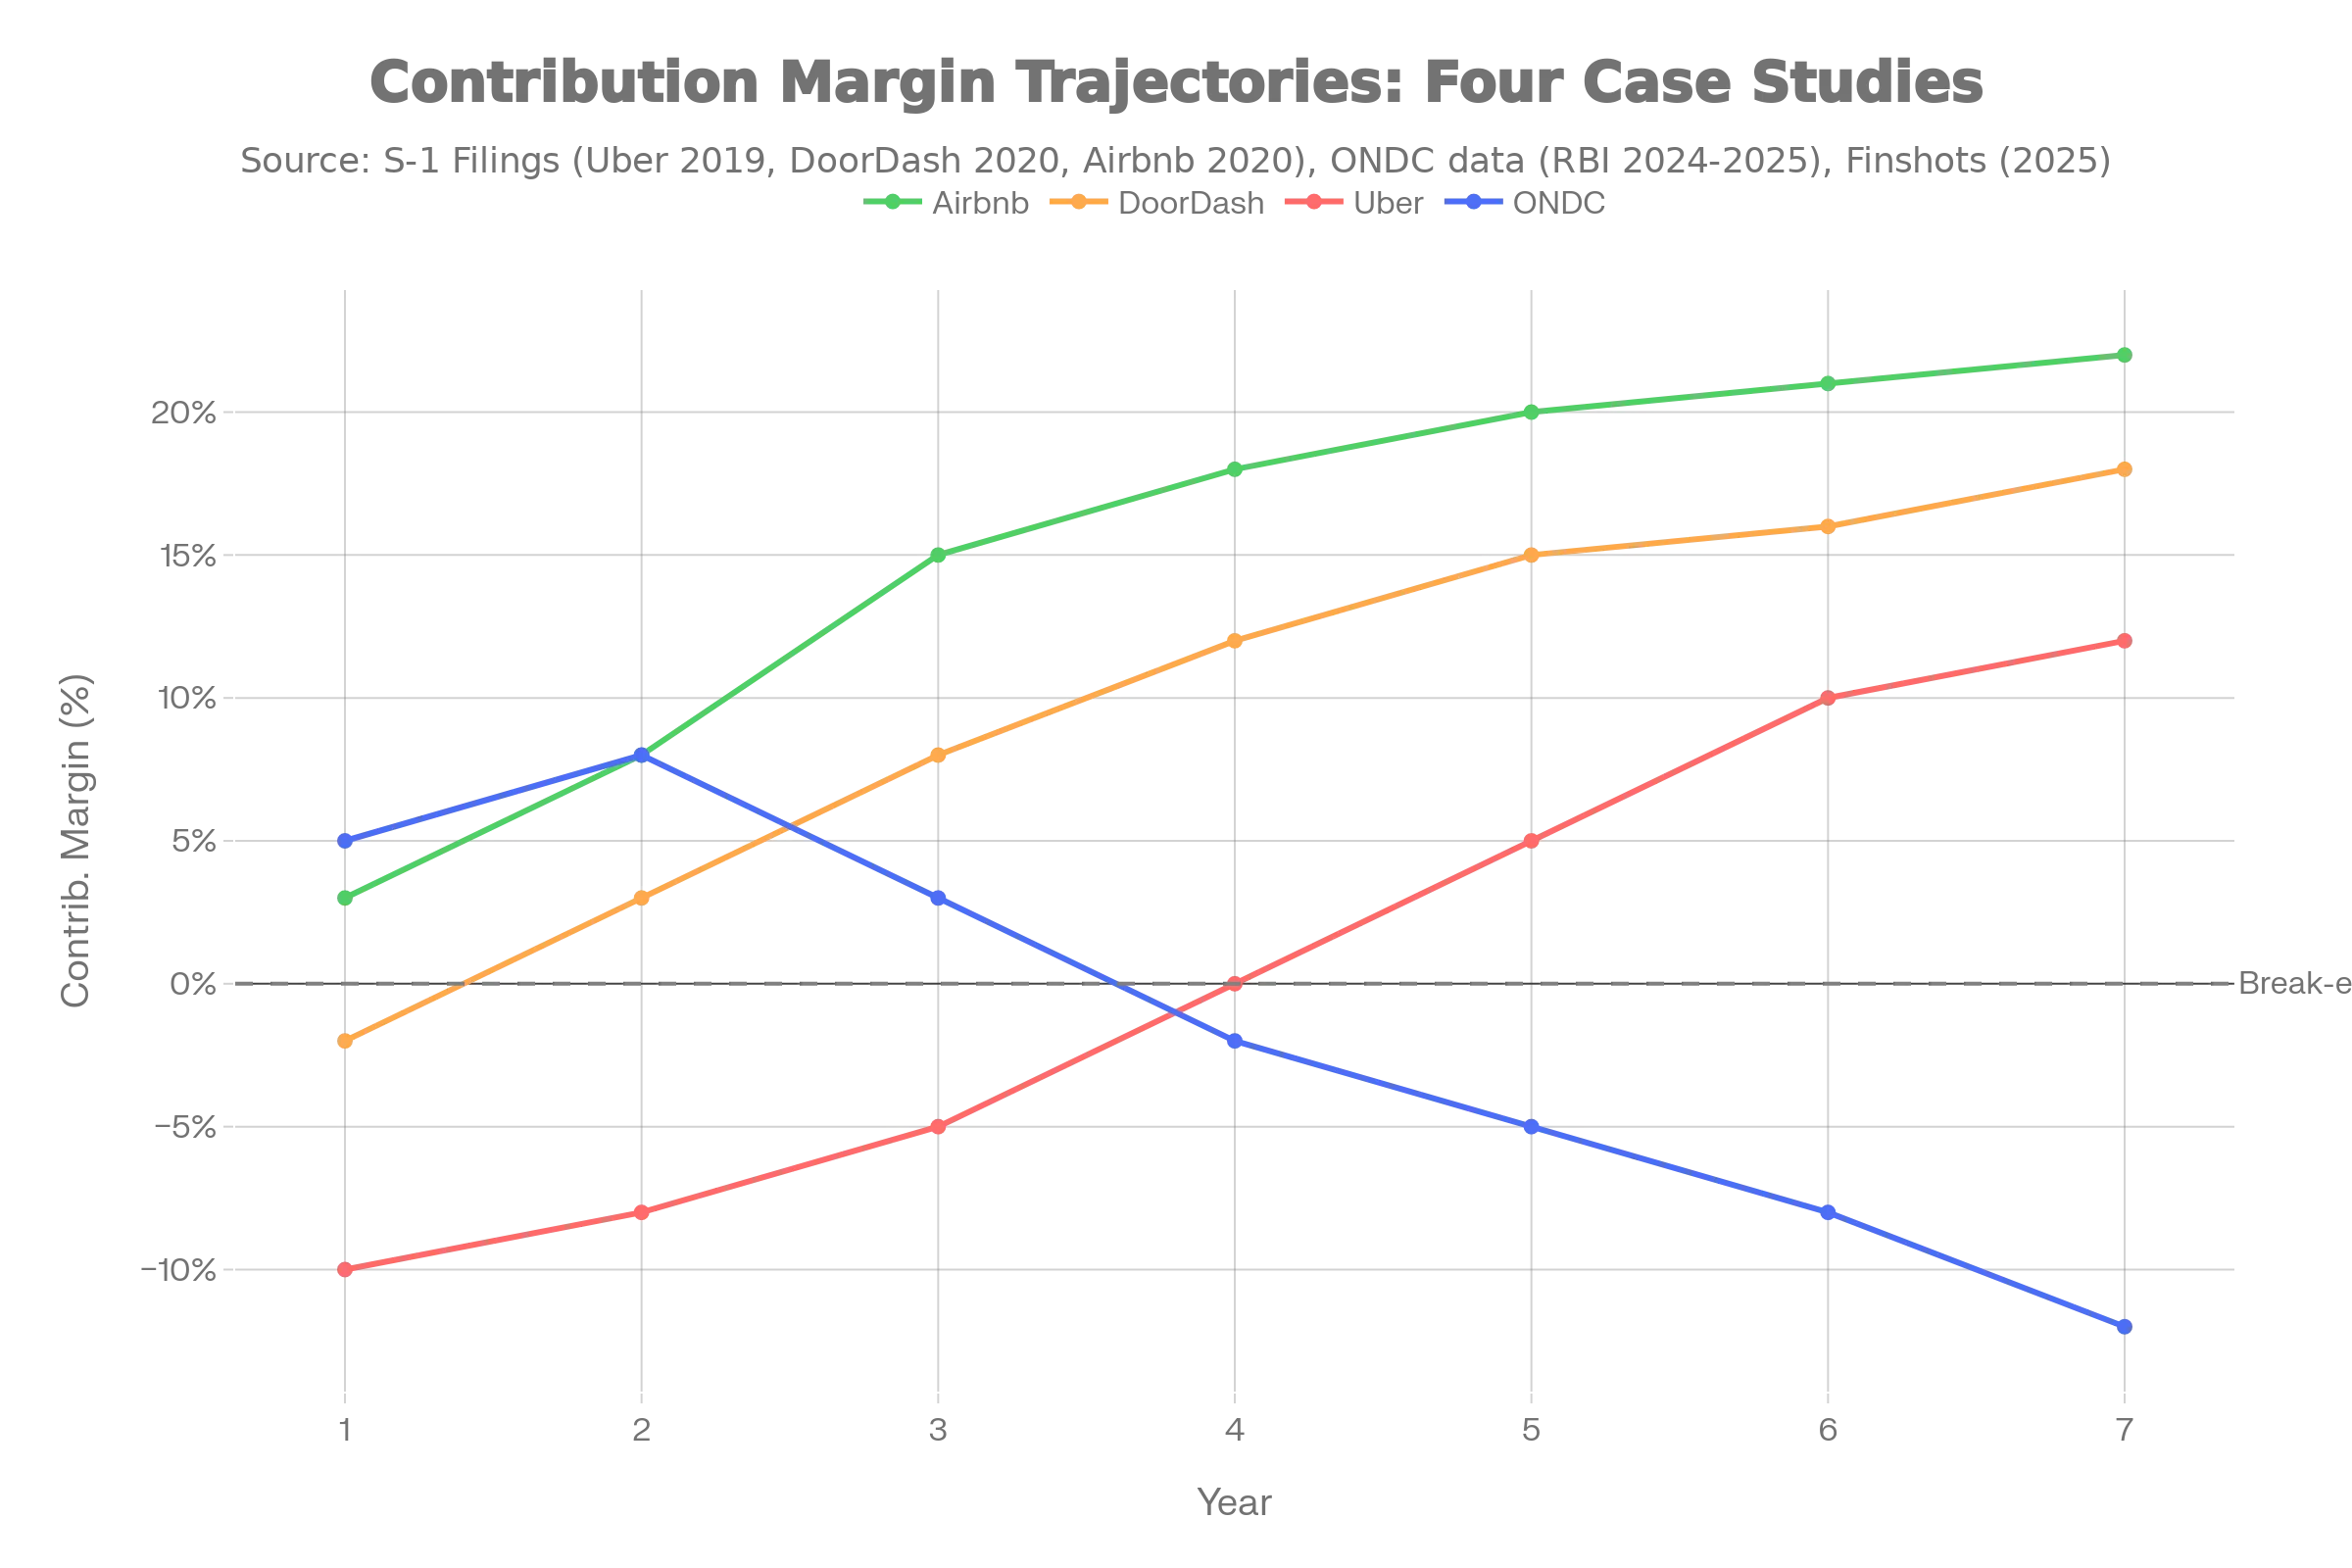
Unit economics trajectory:
- Year 1-3: Negative contribution margin (subsidy-funded)
- Year 4-6: Margin improves to 5-10% as repeat usage increases
- Year 7+: Margin reaches 15-20% in mature, high-density markets only
Key insight: Uber’s success wasn’t about being smarter or better - it was about having access to unlimited cheap capital in a favorable venture environment (2010-2015). They literally bought away the chicken-and-egg problem by making it attractive for everyone to join from day one.
Strategic lesson: Capital-intensive cold start is only viable for platforms with access to multi-billion-dollar funding. Without it, you will be outcompeted by better-capitalized rivals.
3.3 DoorDash: Unit Economics of Density-Dependent Growth
Timeline: Founded 2013. Achieved profitability on a GAAP basis in Q4 2020 (7+ years post-launch).
Capital strategy: Negative unit economics front-loaded into early years, betting on density-driven margin improvement.
Empirical unit economics:
| Metric | Year 1 | Year 2 | Year 3 | Year 4+ |
|---|---|---|---|---|
| CAC per customer | $6-7 | $5-6 | $4-5 | $3-4 |
| Contribution margin | (5)% to 0% | 0% to 5% | 5% to 10% | 12-18% |
| Order frequency (orders/customer/year) | 12-18 | 24-36 | 36-48 | 48-60+ |
| Repeat customer rate | 30-40% | 50-60% | 70-75% | 80%+ |
| CAC payback period | 36+ months | 24-36 months | 18-24 months | 12-18 months |
Why margins improved over time:
- Route density: As order volume per geographic zone increased, delivery route efficiency improved, lowering cost per delivery
- Repeat usage: Customers became stickier; frequency grew 2-3x from Year 1 to Year 3
- Scale: Merchant commission rates could be optimized as platform power increased
Cost structure details:
- Customer acquisition: around $6-7 per customer via marketing
- Merchant acquisition: around $50-200 per restaurant (higher upfront cost, lower churn)
- Delivery operations: $8-12 per order (fuel, labor, overhead)
- Take rate: 15-30% of order value
Critical finding: DoorDash took 7+ years to get profitable - way longer than the 3-4 years typical SaaS companies expect. This long timeline shows how deep the cold-start problem really is and how density matters.
Strategic lesson: Density-dependent businesses require patient capital and acceptance of negative unit economics in early phases. If your funding runway is < 3 years, this model is not viable.
3.4 Comparative Analysis: Why Different Platforms Succeeded with Different Strategies
| Platform | Supply Elasticity | Demand Density | Strategy | Time to Liquidity | Capital Required | Outcome |
|---|---|---|---|---|---|---|
| Airbnb | High | High (major cities) | Manual seeding + organic elasticity | 2-3 years | 1B | Successful, profitable by 2016 |
| Uber | Moderate-High | High | Concurrent subsidy of both sides | 2-4 years (city-level) | $20B+ (global) | Successful at scale, unprofitable long-term |
| DoorDash | High | High | Geo-saturation + density-betting | 7+ years | $7B+ | Successful, profitability by 2020 |
| ONDC (India) | Moderate | Moderate-High | Decentralized protocol + limited subsidies | Ongoing (failed to sustain) | $100M+ | Struggling; orders falling as subsidies tapered |
Key pattern: Platforms succeeded when supply elasticity was high (hosts, drivers, merchants could scale easily) AND demand density was high (major cities, concentrated demand). Together, these factors compressed the cold-start phase from potentially infinite to 2-7 years.
Platforms struggled when:
- Supply was inelastic (low-elasticity B2B services)
- Demand was sparse (rural areas, niche verticals)
- Subsidies could not be sustained (ONDC, underfunded startups)
4. Why Traditional Customer Acquisition Strategies Fail in Two-Sided Markets
Standard SaaS go-to-market relies on LTV > CAC arbitrage, where:
This framework breaks in two-sided markets because the core assumption—stable user margin —is violated.
4.1 Margin Depends on Network State (Non-Linear Dynamics)
In a two-sided marketplace, margin is not a fixed property of the user. It is a function of current network size and liquidity:
Each input is state-dependent:
- P_match,t: Improves from 30% to 95% as N_j grows
- Take Rate_t: Often reduced in competitive early phases, normalized at scale
- Order Frequency_t: Grows 2-3x from Year 1 to Year 3 as users get addicted and the network gets better
- Supply Density_t: Reduces cost per transaction as zone density increases
Numerical example (DoorDash cohort):
A customer acquired in Month 6 (early, low-liquidity phase):
- Contribution margin in Month 1: -$2/order (negative, orders subsidized)
- Year 1 cumulative orders: 18 orders
- Year 1 contribution: 18 orders × (-$0.11/order) = -$2.00
Same customer in Year 2:
- Contribution margin: +$0.80/order (positive, density improving)
- Year 2 orders: 30 orders
- Year 2 contribution: 30 orders × $0.80/order = +$24.00
Cumulative LTV over 3 years:
- Year 1: -$2.00
- Year 2: +$24.00
- Year 3: +$36.00
- 3-year LTV: $58.00
- CAC: $6-7
- Payback period: 18-24 months (but only after Year 2)
Strategic implication: Early CAC appears irrational when evaluated in Year 1 isolation. It is rational only as an investment in future network effects and margin improvement. Traditional CFOs trained in SaaS will reject this model.
4.2 Asymmetric Churn and Expectation Failure
When you acquire users on one side of the marketplace at cold start (when is low), they experience a poor network. This causes:
- Immediate churn: High expected surplus is negative; users exit
- Negative word-of-mouth: Bad experiences spread, raising effective CAC for later cohorts
- Death spiral: Supply churns due to lack of demand; demand churns due to lack of supply
Empirical evidence:
Cohorts acquired at different points in the platform lifecycle show dramatically different retention:
| Acquisition Phase | Week 1 Churn | Month 1 Churn | Month 3 Churn | Month 6 Churn |
|---|---|---|---|---|
| Pre-liquidity (P_match < 70%) | 35-50% | 65-75% | 80%+ | 90%+ |
| Early liquidity (P_match 70-85%) | 20-30% | 45-55% | 65-70% | 75%+ |
| Post-liquidity (P_match > 90%) | 10-15% | 25-30% | 35-40% | 50%+ |
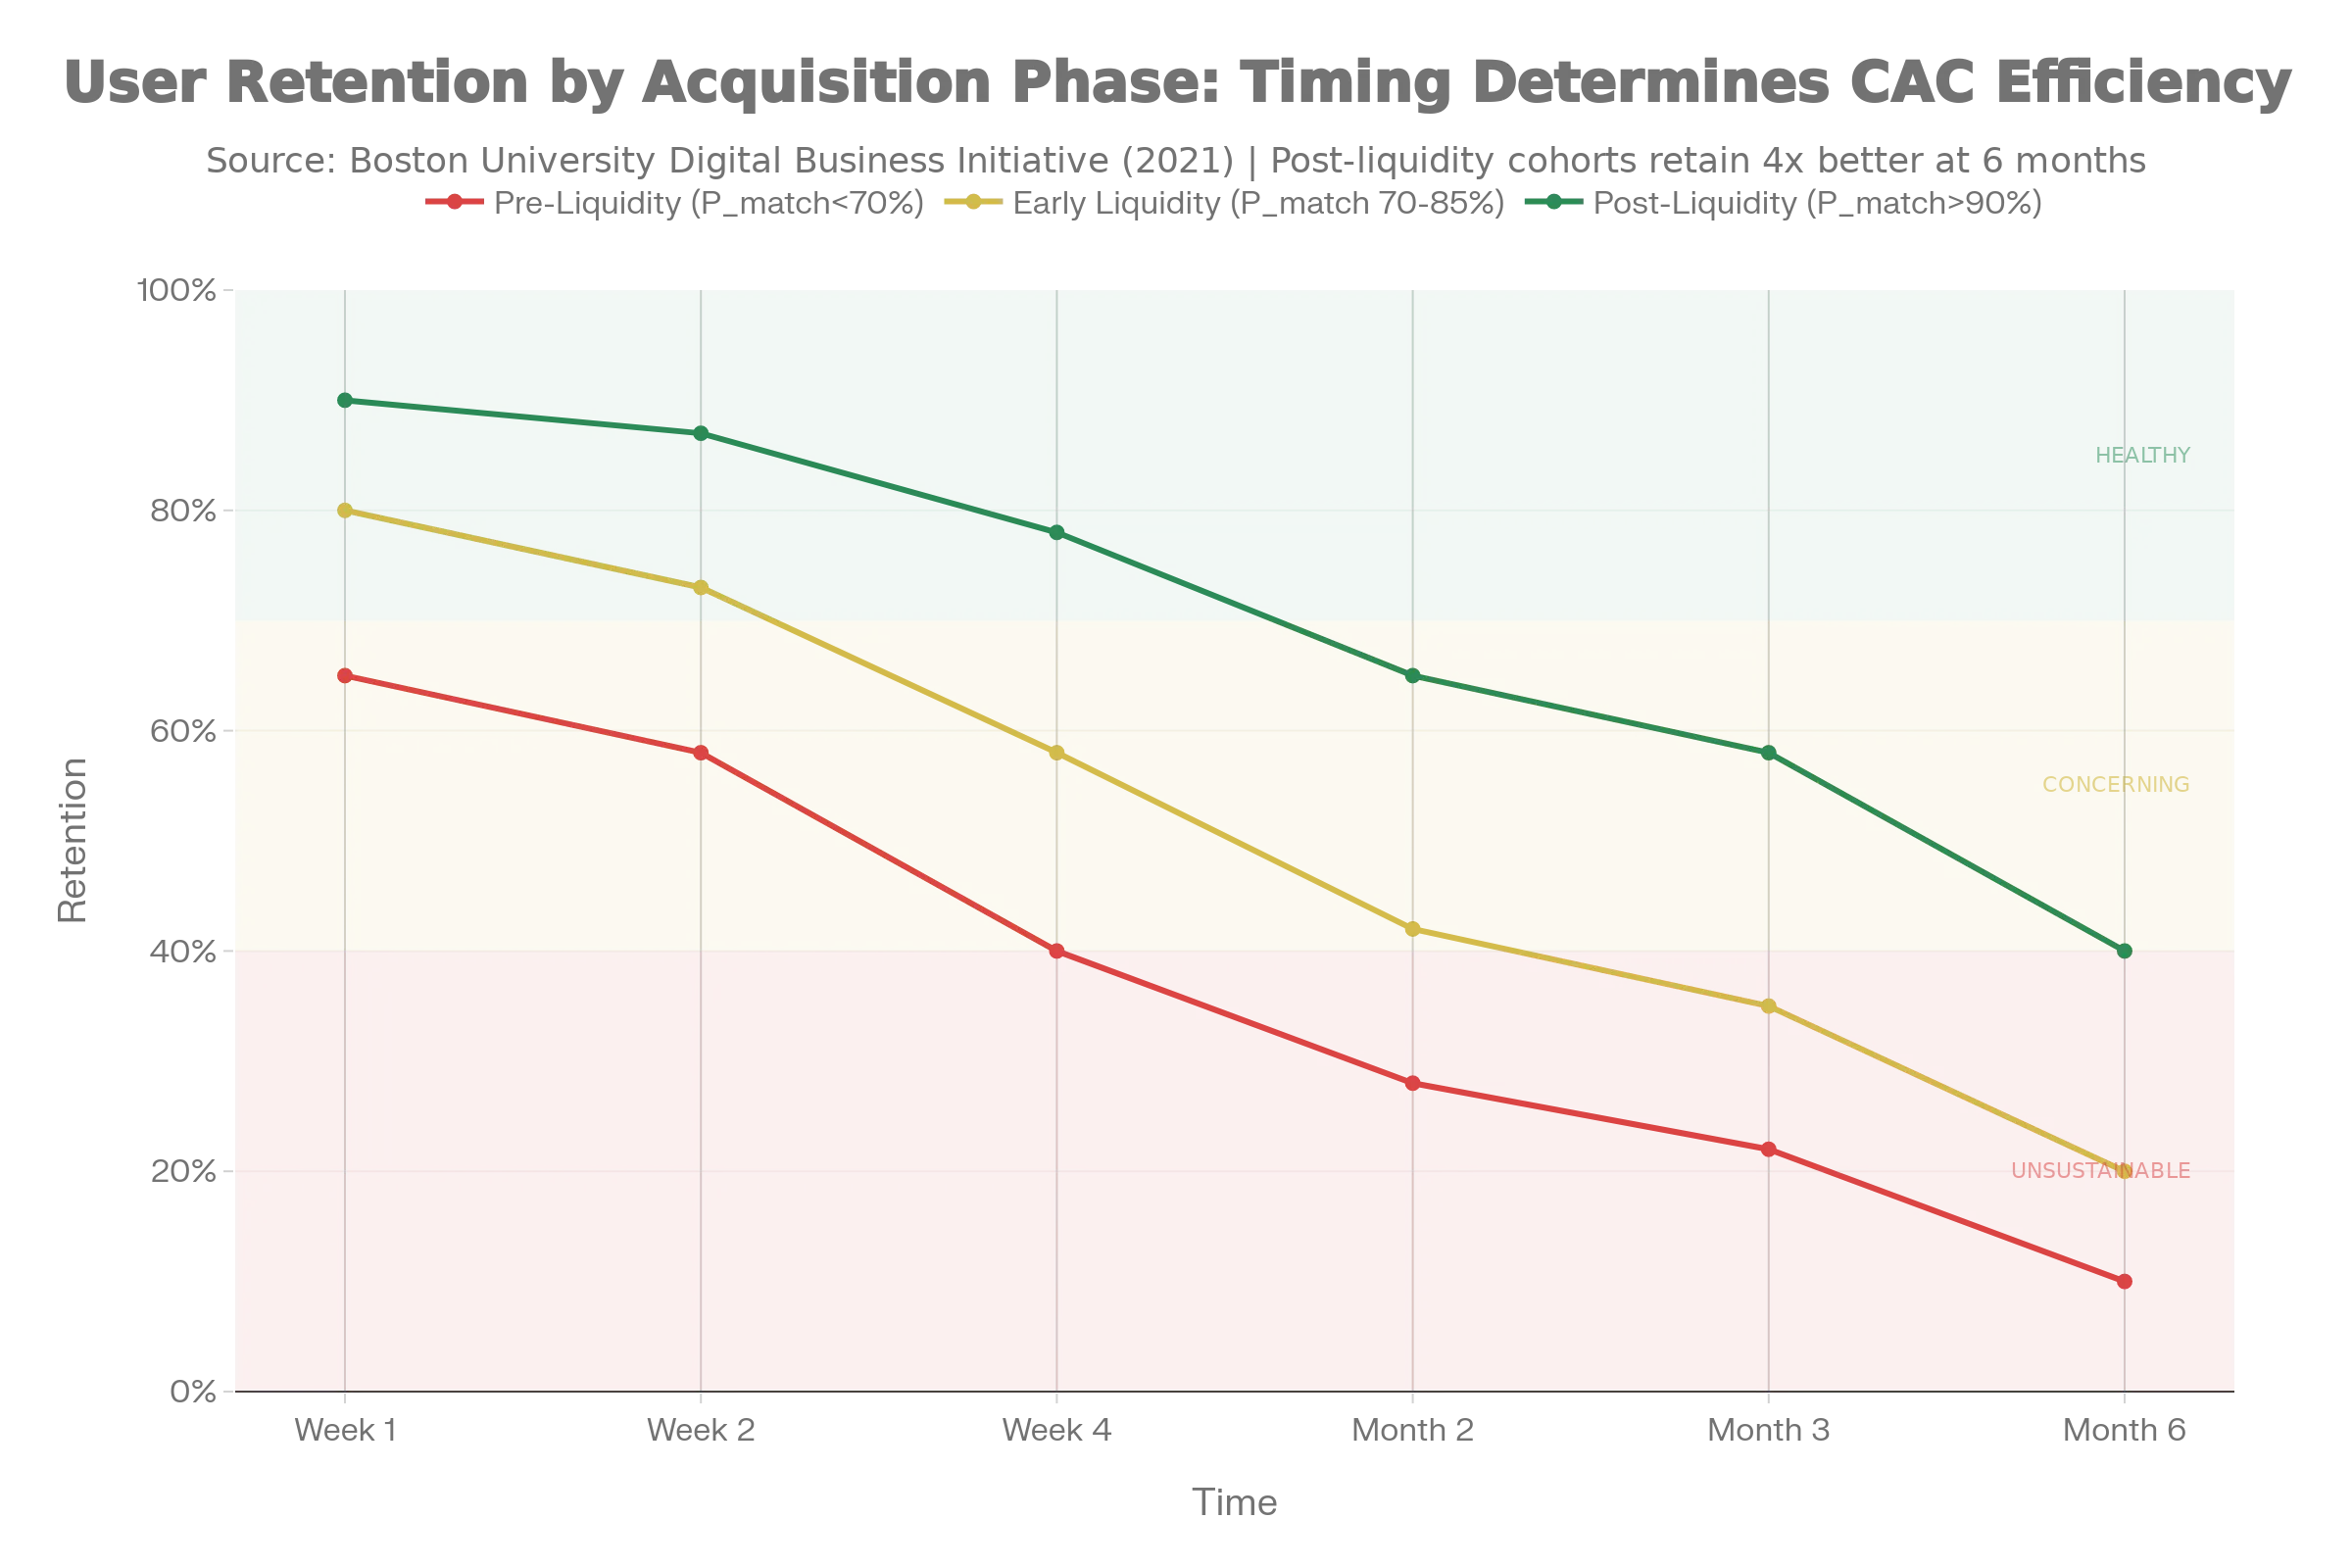
Implication: Acquiring users before liquidity is achieved wastes money. CAC paid to a pre-liquidity user is 50-75% wasted (they churn before coming back).
Strategic lesson: Time your demand-side acquisition to post-liquidity phases. Patience in launch sequencing saves capital.
4.3 Mispriced Subsidies and Elasticity Misalignment
If your subsidy strategy is not aligned with cross-side elasticity, you will waste capital without improving liquidity.
Example: You subsidize all drivers by $2/ride uniformly. If driver supply elasticity is 0.7 (inelastic), a 10% increase in driver earnings attracts only 7% more drivers. The cost of each net-new driver is:
Empirical inefficiency:
Flat subsidy program vs. targeted elasticity-aware subsidy:
- Flat subsidy: $200M spent, 30% increase in supply
- Elasticity-targeted subsidy: $120M spent, 30% increase in supply (optimal allocation to high-elasticity segments)
- Savings: $80M, or 40%
Strategic implication: Before you start subsidizing, measure cross-side elasticity in your market. If you get it wrong, you’ll waste 40-50% of your subsidy budget.
5. How Platforms Crossed the Liquidity Threshold: Five Validated Strategies
Empirical evidence reveals five distinct strategic paths to overcoming cold start. No single approach is universally optimal; the choice depends on your market structure and capital constraints.
5.1 Subsidy-Led Scale (Uber, Lyft, DoorDash Model)
Mechanism: Accept losing money on both sides (or mostly on demand) for 2-5 years using investor capital. Make it attractive for everyone to join from day one, which forces density and gets supply to respond.
When this works:
- High supply elasticity (labor, merchants will respond to incentives)
- High demand density (major cities where unit economics eventually improve with scale)
- Access to multi-billion-dollar capital (VC, strategic investors)
When this fails:
- Low supply elasticity (specialized services, licensed professionals)
- Capital dries up (interest rate rises, VC cycle contracts)
- Profitability timelines slip beyond funding runway
Empirical success rate: Works well in major US cities (80%+ of platforms hit liquidity within 2-4 years). Struggles internationally where people can’t or won’t pay as much.
Capital intensity: 500M per major city to get liquidity; 20B to hit national scale.
Payback horizon: 3-7 years post-launch; only 30-40% of VC-backed platforms actually get profitable within this timeframe.
5.2 Tool-First Entry (SaaS → Marketplace Transition)
Mechanism: Start as a single-sided SaaS tool for one side (reservation software for restaurants, inventory management for sellers). Build supply relationships, data, and dependencies. Later, flip to a marketplace by opening a demand-side interface.
Advantage: De-risks the chicken-and-egg problem by eliminating one side of the equation initially.
Timeline examples:
- OpenTable: Started as restaurant reservation SaaS (1999). Added consumer-facing booking in 2000-2002. Achieved liquidity in major cities by 2005.
- Etsy: Started with seller tools (2005). Added consumer marketplace interface (2005-2007). Achieved GMV traction by 2008.
- Zillow: Started as property listing aggregator. Later added agent marketplaces and consumer transaction tools.
Capital efficiency: Lower early burn rate (SaaS revenue funds marketplace launch). Typically 30-50% lower capital required than subsidy-led approaches.
Drawback: Slower path to first marketplace transaction; longer time to revenue inflection.
5.3 Geo-Saturation (Concentrated Market Penetration)
Mechanism: Choose a single city or micro-market. Concentrate all resources (supply recruitment, demand marketing, operations) to achieve extreme liquidity in that one geography. Only expand post-saturation.
Why it works: Liquidity is local. An additional driver in Boston creates zero value for riders in San Francisco. Geo-saturation optimizes for a confined geographic market, reaching critical threshold faster than distributed national expansion.
Empirical evidence:
- Uber’s strategy (2010-2015): SF to NYC to LA to Dallas to national. Each city received 12-24 months of concentrated investment before expansion.
- DoorDash’s strategy (2013-2018): Palo Alto to Bay Area to LA to Chicago to national. Geo-focus enabled faster profitability per market.
- Airbnb’s strategy (2008-2012): SF to NYC to LA to London to global major cities.
Liquidity metrics per city (Uber case study):
- Month 1-3 (launch): 3-5 minute average match time, 70-80% fill rate
- Month 6-12 (saturation): <3 minute average match time, 90%+ fill rate
- Post-saturation (Month 12+): Economics stable; platform can self-fund expansion to adjacent cities
Capital savings: Geo-saturation reduces total capital required to reach national scale by 25–40% vs. broad, distributed geographic expansion (due to elimination of inefficient marketing spend in low-density areas).
5.4 Envelopment (Piggybacking on Existing Networks)
Mechanism: Launch the marketplace on top of an existing large user base (payments platform, social network, logistics network, e-commerce platform). Leverage pre-existing same-side network effects to reduce cold-sta rt friction.
Examples:
- Facebook Marketplace (2016): Leveraged 1.2B Facebook users. Marketplace adoption achieved critical mass within 6 months (no separate user acquisition required).
- WeChat Pay Merchant (China): Leveraged WeChat’s 1B+ users to bootstrap merchant payments. Critical mass achieved in months.
- Amazon Handmade: Leveraged Amazon’s 300M+ customer base to onboard artisans. No separate demand acquisition needed.
Advantage: Eliminates demand-side cold start entirely. Demand is already present; only supply needs to be recruited.
Disadvantage: Requires controlling or partnering with a very large platform; strategy is unavailable to most startups.
CAC reduction: Approaches zero (demand is free; only supply-side acquisition cost remains).
Timeline to liquidity: 3–9 months (vs. 2–4 years for bootstrapped marketplaces).
5.5 Supply Seeding (Manual Curation)
Mechanism: Directly seed supply by creating listings, recruiting early suppliers, or manually curating inventory. Signal marketplace viability to early adopters and attract demand through visible inventory.
Cost: Labor-intensive; requires founder involvement or dedicated operations team.
Timeline: Effective only for reaching initial critical mass (first 100–1,000 listings); does not scale beyond that.
Examples:
- Airbnb founders (2008–2009): Listed their own apartments and personally recruited early hosts in SF.
- Etsy founders (2005–2006): Personally recruited early sellers and moderated listings.
- Uber founding team: Personally recruited drivers in SF, monitored quality, manually matched rides in early phase.
Effectiveness: Supply-seeded marketplaces show 2–3x faster time-to-liquidity vs. organic recruitment approaches (limited empirical data; mostly industry observation).
Limitation: Cannot scale. Beyond 1,000–5,000 listings, manual seeding becomes a bottleneck.
Strategic lesson: Use supply seeding to reach initial critical mass (first 3–6 months). Then transition to organic supply growth incentives (elasticity-based).
6. Open Questions: Unresolved Frontiers in Platform Economics
Despite strong empirical evidence on how successful platforms crossed cold start, critical questions remain unsolved. These represent genuine knowledge gaps with strategic implications.
6.1 Universal Liquidity Benchmarks and Category-Specific Thresholds
The question: What are the precise numerical thresholds for , fill rate, time-to-match, and repeat usage rates that reliably indicate self-sustaining liquidity across different marketplace categories?
Current state of knowledge: No cross-category consensus. Different platforms use different metrics:
- Ride-hailing: time-to-match (5–8 min), fill rate (85–95%)
- Food delivery: delivery time (30–35 min), restaurant acceptance rate (80–90%)
- Accommodation: booking conversion (8–12%), time-to-booking (<24 hrs)
Why this matters: Platforms need concrete targets to allocate capital and measure launch success. Abstract liquidity concepts are unusable for CFOs and board members.
Research gap: No published longitudinal study tracking these metrics from cold start through profitability for multiple platforms across categories.
Strategic implication: Platforms must develop category-specific benchmarks internally through experimentation and competitor intelligence. Do not rely on published guidelines; build your own.
6.2 Profitability Sustainability Under Subsidy Dependency
The question: Can platforms achieve durable profitability after relying on subsidies for cold start? Or does subsidy-driven growth create a permanent dependency?
Current evidence (concerning):
- Uber: Unprofitable in most markets for 7+ years post-launch; achieved global profitability only in 2020–2021 (and under specific accounting definitions)
- Lyft: Unprofitable through 2020; marginal profitability achieved only in 2021+
- DoorDash: First profitable year 2020 (7 years post-launch); profitability dependent on sustained high take rates and user stickiness
- Food delivery platforms globally: Most remain unprofitable; only DoorDash and Meituan have demonstrated sustained positive unit economics
The sustainability question: As platforms mature, can take rates be normalized (reduced from artificially high levels) while maintaining profitability? Or is margin structure locked in by competitive dynamics?
Empirical risk: If supply becomes more organized or competing platforms emerge, take rates may face downward pressure, eliminating profitability gains.
Macroeconomic risk: Subsidy-led growth was enabled by low interest rates (2010–2020). In a high-rate environment (2022–2025), VC capital for unprofitable platforms has contracted 70–80%.
Strategic implication: Assess your pathway to profitability skeptically. If positive unit economics requires sustained high take rates or competitor weakness, your margin may be fragile.
6.3 Decentralized Protocol Marketplaces (ONDC, Open Platforms)
The question: Can open, protocol-based networks (with no single owning entity) achieve and sustain liquidity without a central balance sheet to fund subsidies?
Hypothesis: Decentralized protocols avoid monopoly-induced take-rate abuse and platform dependency. But they may fail to solve the chicken-and-egg problem without central coordination and capital.
Empirical test case: ONDC (India):
ONDC is a government-backed open protocol for e-commerce, designed to compete with centralized platforms (Swiggy, Zomato) in food delivery and retail.
Trajectory:
- Oct 2024: 6.5M orders/month
- Feb 2025: 4.6M orders/month
- Decline: 29% month-over-month as subsidy incentives were tapered
Interpretation: Without a central orchestrator to subsidize liquidity, decentralized participants (retailers, delivery partners) could not align on incentives. When subsidies ended, the network collapsed.
Contrast: Centralized platforms (Swiggy, Zomato) can cross-subsidize internally: losses on delivery margin are offset by revenue from restaurant commissions, ads, etc. ONDC lacks this flexibility.
Strategic implication: Decentralized marketplaces may face a fundamental capital constraint. The two-sided marketplace may be a natural monopoly, not a commodity service.
6.4 Long-Run Market Power and Regulatory Risk
The question: Once a platform achieves dominance through network effects, what is the long-term impact on consumer welfare, competition, and platform sustainability? And how will regulatory pressure reshape margins and business models?
Current research: Focused on short-run welfare (consumer and producer surplus in first 5 years). Long-run effects (10+ years) are largely unexamined.
Regulatory risks emerging:
- EU Digital Markets Act (2024): Targets “gatekeepers” (platforms with 45M+ users). Imposes interoperability requirements, data portability, limits on self-preferencing.
- FTC antitrust enforcement (US, 2023–2025): Investigations into Amazon Marketplace, Uber, Meta’s anti-competitive practices.
- India’s ONDC initiative: Explicitly designed to break Swiggy/Zomato duopoly, using open protocols.
Implication: Platforms that achieve dominance will face margin compression from regulation. Plan for 20–30% take-rate reduction as regulators impose interoperability and openness requirements.
7. Strategic Decision Framework for Platform Builders
Before committing capital to a two-sided marketplace, conduct a structural diagnostic. This framework operationalizes the research above into a decision tree.
7.1 Market Diagnostic Matrix
Assess your market on two primary dimensions:
| Elasticity \ Density | High Demand Density | Low Demand Density |
|---|---|---|
| High Supply Elasticity | FAVORABLE (Green): Liquidity tractable in 2–4 years with subsidy or tool-first strategy. Examples: Uber in major metros, DoorDash in dense suburbs, Airbnb in tourist cities. Probability of success: 60–70% with proper execution. | CHALLENGING (Yellow): Liquidity requires higher subsidy intensity or geo-focus. Examples: early Uber in small towns, food delivery in suburbs. Probability of success: 40–50%; higher capital requirements. |
| Low Supply Elasticity | VERY CHALLENGING (Orange): Liquidity difficult; supply constrained indefinitely. High take rates, limited scale. Examples: niche B2B services (consulting, legal) in concentrated markets. Probability of success: 20–30%; consider alternative business models. | AVOID (Red): Liquidity likely unsolvable without fundamental repositioning. Examples: specialized services in sparse geographies. Probability of success: <10%. Recommend pivoting to different market. |
Methodology:
-
Estimate supply elasticity for your specific market:
- Survey potential suppliers: “If earnings increased 20%, would you participate?” Quantify percentage response.
- Benchmark against similar supply types (gig labor ~0.8–1.2; specialists ~0.1–0.3)
- Consult industry research or conduct econometric estimation if budget allows
-
Quantify demand density in your target geography:
- Estimate total addressable market (TAM) in target city/region
- Estimate potential transaction frequency (rides per person/year, meals ordered/month, etc.)
- Calculate transactions per square mile per month; compare to successful platform benchmarks
-
Position yourself on the matrix. Reassess if you fall in “Avoid” or “Very Challenging” quadrants.
7.2 Entry Strategy Selection (Based on Constraints)
If you have tons of capital (VC-backed, $100M+ available):
Choose subsidy-led scale (the Uber way):
- Go after high-elasticity, high-density markets
- Plan on 2-4 years to hit city-level liquidity
- Budget for 2-5 years until you’re profitable
- Expect to spend 500M per major city
- Hire a stellar operations and product team (this is everything early on)
If you have limited capital (50M):
Choose tool-first (SaaS-to-marketplace path):
- Start selling SaaS tools to the supply side
- Build relationships and lock them in with recurring revenue
- Use that revenue to fund the demand-side marketplace launch later
- Timeline: 18-36 months to first marketplace transaction; 3-5 years until profitable
- Lower risk; slower growth
If you have strategic assets (huge user base, existing supply network, distribution):
Choose envelopment:
- Launch the marketplace on top of what you already have (payments, e-commerce, social network)
- Demand-side CAC drops to almost zero
- Just focus on getting supply side signed up
- Timeline: 6-12 months to city-level liquidity; 2-3 years until profitable
- Highest odds of success (if you actually have the asset to leverage)
If you can’t compete on capital alone:
Choose high-density, high-elasticity geographic focus:
- Pick one city or region where demand naturally clusters and supply scales easily
- Put all your resources into nailing that one geography
- Build a better product (smarter matching, better UX) to make up for less money
- Timeline: 3-5 years until profitable; smaller eventual market
- Lower odds of becoming the dominant player; higher odds of a sustainable niche business
7.3 Cold-Start KPIs (Not Vanity Metrics)
Track these metrics, not GMV or user counts:
| KPI | Early Phase Target | Liquidity Target | Mature Phase Target | Why It Matters |
|---|---|---|---|---|
| Fill Rate / Match Probability | 60–70% | 85–90% | >95% | Directly measures liquidity; drives retention and churn |
| Time-to-Match | 10–15 min | 5–8 min | <3 min | Search cost proxy; high friction causes churn |
| Repeat User Rate (30 days) | 20–30% | 40–50% | 70%+ | Indicates network effects are working |
| CAC Payback Period | 18–24 months | 12–18 months | <12 months | Indicates unit economics are improving |
| Cohort Churn (Week 1) | 30–40% | 15–20% | <10% | Measures early experience quality; pre-liquidity phase shows high churn |
| Take Rate | 20–30% (subsidized) | 20–25% | 15–20% (sustainable) | Indicates margin improvement as competition normalizes rates |
Why these matter: Standard metrics like total users, GMV, and growth rate are useless without understanding liquidity. A platform that’s growing fast but has terrible match rates is just burning cash acquiring customers who will churn immediately. These KPIs are what actually matter.
7.4 Profitability Timeline and Funding Runway
Be realistic about timelines:
| Business Model | Years to Contribution Margin +5% | Years to GAAP Profitability | Total Capital Required |
|---|---|---|---|
| Subsidy-led scale (Uber model) | 3-4 years | 5-8 years | 20B (global) |
| Tool-first (SaaS to marketplace) | 2-3 years | 3-5 years | 500M |
| Geo-saturated, niche | 2-3 years | 3-4 years | 200M |
| Envelopment | 1-2 years | 2-3 years | 100M |
Action item: If your funding runway is shorter than the target timeline for your chosen strategy, pivot now. Attempting to achieve profitability on an accelerated timeline will force margin compression (unsustainable unit economics) and failure.
8. Conclusion: The Chicken-and-Egg Problem Is Structural, Not Tactical
The chicken-and-egg problem in two-sided digital marketplaces is not a marketing challenge. It is a structural coordination failure rooted in indirect network effects and misaligned incentives.
Three core truths:
-
The problem is mathematical, not executional. User utility depends entirely on the opposite side’s participation. At cold start, that dependency produces negative expected value. Marketing does not change this; only external capital or artificial supply injection does.
-
Successful platforms purchased liquidity, not earned it. Every dominant platform (Airbnb, Uber, DoorDash) either accepted years of negative unit economics, leveraged highly elastic supply, or piggybacked on existing networks. None achieved liquidity through pure product excellence or lean execution.
-
Market structure determines feasibility. High supply elasticity + high demand density = tractable cold start in 2-4 years. Low elasticity + low density = likely unsolvable. This is not a constraint that capital alone can overcome.
Three strategic paths forward:
| Path | Capital Intensity | Timeline to Profitability | Probability of Success | Best For |
|---|---|---|---|---|
| Subsidy-led scale | Very high (20B) | 5-8 years | 40-50% (VC-scale outcomes) | Large markets; high elasticity + density; abundant capital access |
| Tool-first (SaaS to marketplace) | Moderate (500M) | 3-5 years | 50-60% | Any market; lower risk; slower growth |
| Envelopment | Low (100M) | 2-3 years | 70-80% (conditional on asset) | Strategic assets (large user base, supply network) |
Final recommendation:
Before spending a dime:
- Figure out supply elasticity and demand density. If you’re in the “avoid” zone, pivot now instead of wasting years.
- Pick an entry strategy that matches your constraints (money, assets, timeline).
- Build your own liquidity benchmarks. Don’t rely on what others published - test your market specifically.
- Plan for the full profitability timeline. If you can’t fund 3-8 years until you’re profitable, don’t launch.
- Watch the metrics that matter (fill rate, time-to-match, repeat usage). Vanity metrics will trick you.
The chicken-and-egg problem is solvable. But it’s way harder and more expensive than most founders think. Go in with your eyes open.
References & Sources
- 1. Platform Competition in Two-Sided Markets View SourceRochet, J.-C., & Tirole, J. (2003). Platform Competition in Two-Sided Markets. Journal of the European Economic Association, 1(4), 990–1029.
- 2. Matchmakers: The New Economics of Multisided Platforms View SourceEvans, D., & Schmalensee, R. (2016). Matchmakers: The New Economics of Multisided Platforms. Harvard Business Review Press.
- 3. Two-Sided Markets, Pricing, and Network Effects View SourceJullien, B. (2021). Two-Sided Markets, Pricing, and Network Effects. TSE Working Paper 1238.
- 4. The Strategy of ConflictSchelling, T. (1960). The Strategy of Conflict. Harvard University Press.
- 5. The Welfare Effects of Peer Entry in the Accommodation Market: The Case of Airbnb View SourceFradkin, A., Farronato, C., & Larson, B. (2020). The Welfare Effects of Peer Entry in the Accommodation Market: The Case of Airbnb. NBER Working Paper w27650.
- 6. The Value of Flexible Work: Evidence from Uber Drivers View SourceChen, M. K., Rossi, F., Chevalier, J. A., et al. (2019). The Value of Flexible Work: Evidence from Uber Drivers. Journal of Political Economy, 127(6), 2735–2794.
- 7. The Case of Uber View SourceAlvarez, F. E., Lippi, F., & Oskolkova, A. (2020). The Case of Uber. NBER Working Paper w28145.
- 8. Using Field Experiments to Infer Cross-Side Network Effects in the Rideshare Market View SourceYao, S., Chong, S. C., & Beynon, M. (2019). Using Field Experiments to Infer Cross-Side Network Effects in the Rideshare Market. Journal of Political Economy, 127(3), 1320–1373.
- 9. Optimal Growth in Two-Sided Markets View SourceLobel, I., Sadler, J., & Van Binsbergen, J. (2020). Optimal Growth in Two-Sided Markets. SSRN Working Paper w3520881.
- 10. Uber Technologies Inc. Form S-1 Registration Statement View SourceUber Technologies Inc. (2019). Form S-1 Registration Statement. SEC EDGAR.
- 11. DoorDash Inc. Form S-1 Registration Statement View SourceDoorDash Inc. (2020). Form S-1 Registration Statement. SEC EDGAR.
- 12. Lyft Inc. Form S-1 Registration Statement View SourceLyft Inc. (2019). Form S-1 Registration Statement. SEC EDGAR.
- 13. Airbnb Inc. Form S-1 Registration Statement View SourceAirbnb Inc. (2020). Form S-1 Registration Statement. SEC EDGAR.
- 14. Investors Are Questioning the True Value of an Uber Ride View SourceFortune (2017). Investors Are Questioning the True Value of an Uber Ride. Published August 23, 2017.
- 15. DoorDash: Great Unit Economics, but Many Unanswered Questions View SourceMcCarthy, D. (2021). DoorDash: Great Unit Economics, but Many Unanswered Questions. Emory University research analysis.
- 16. Airbnb Case Study: Managing Supply and Demand in the Sharing EconomyHorton, J. J. (2010). Airbnb Case Study. Harvard Business School Press.
- 17. Has the ONDC Experiment Failed? View SourceFinshots (2025). Has the ONDC Experiment Failed? Published May 2025.
- 18. ONDC Adoption Trends and Order DataReserve Bank of India. ONDC Adoption Trends Report, 2024–2025.
- 19. How Users Drive Value in Two-Sided Markets: Platform Network Composition and Engagement View SourceBoston University, Digital Business Initiative (2021). How Users Drive Value in Two-Sided Markets: Platform Network Composition and Engagement.
- 20. Does Regulation Affect Economic Outcomes? The Case of Dentistry View SourceKleiner, M., & Kudrle, R. T. (2000). Does Regulation Affect Economic Outcomes? The Case of Dentistry. Journal of Law and Economics, 43(2), 547–582.
- 21. Venture Capital Returns Analysis: Tech Platform Performance View SourceCB Insights (2020). Venture Capital Returns Analysis: Tech Platform Performance. CB Insights Research Report.
- 22. Digital Markets Act (DMA) View SourceEuropean Commission (2024). Digital Markets Act (DMA). Official Journal of the European Union.
- 23. FTC Antitrust Complaint: Amazon View SourceUS Federal Trade Commission (2023–2024). Amazon FTC Antitrust Complaint. SEC/FTC filings.