Water and Economic Development: The Hidden Constraint Behind Growth
Executive Summary
Water scarcity and water management are not seasonal headline issues in India; water availability is a fundamental structural input that directly constraints India’s economic growth model, with quantifiable impacts on agricultural productivity, urbanization rates, and macroeconomic volatility. Research reveals four distinct patterns linking water stress to reduced economic growth.
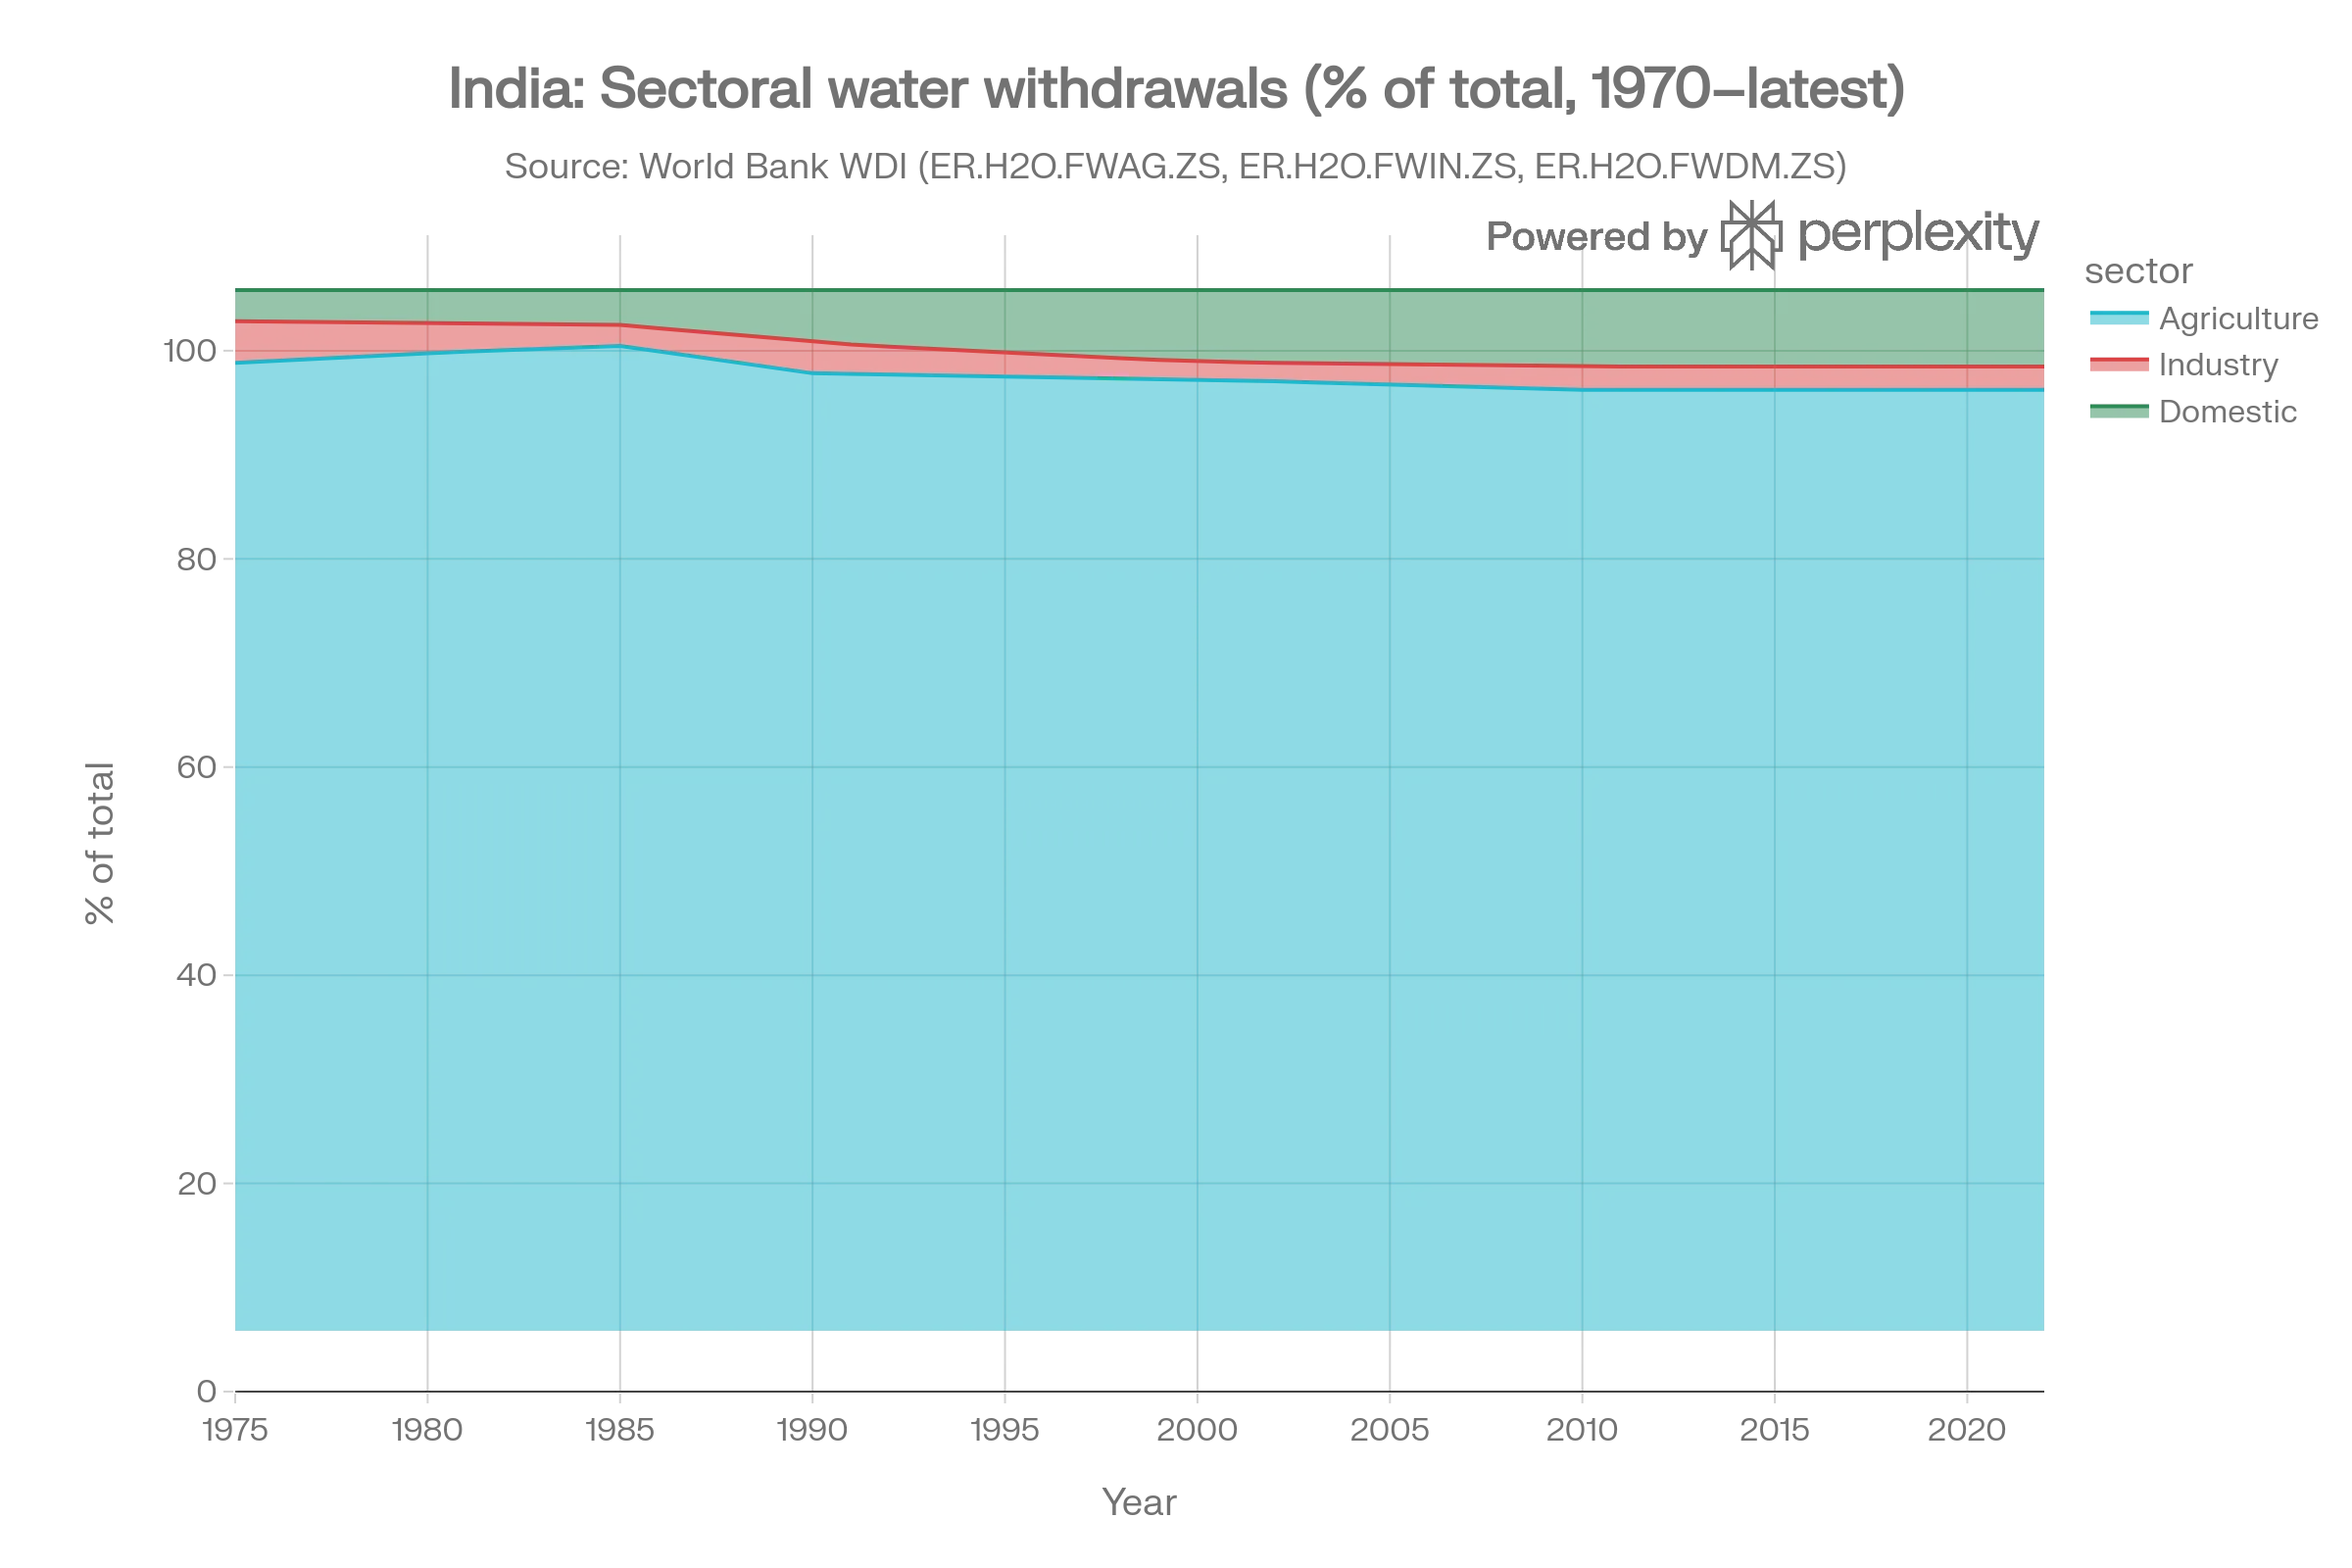
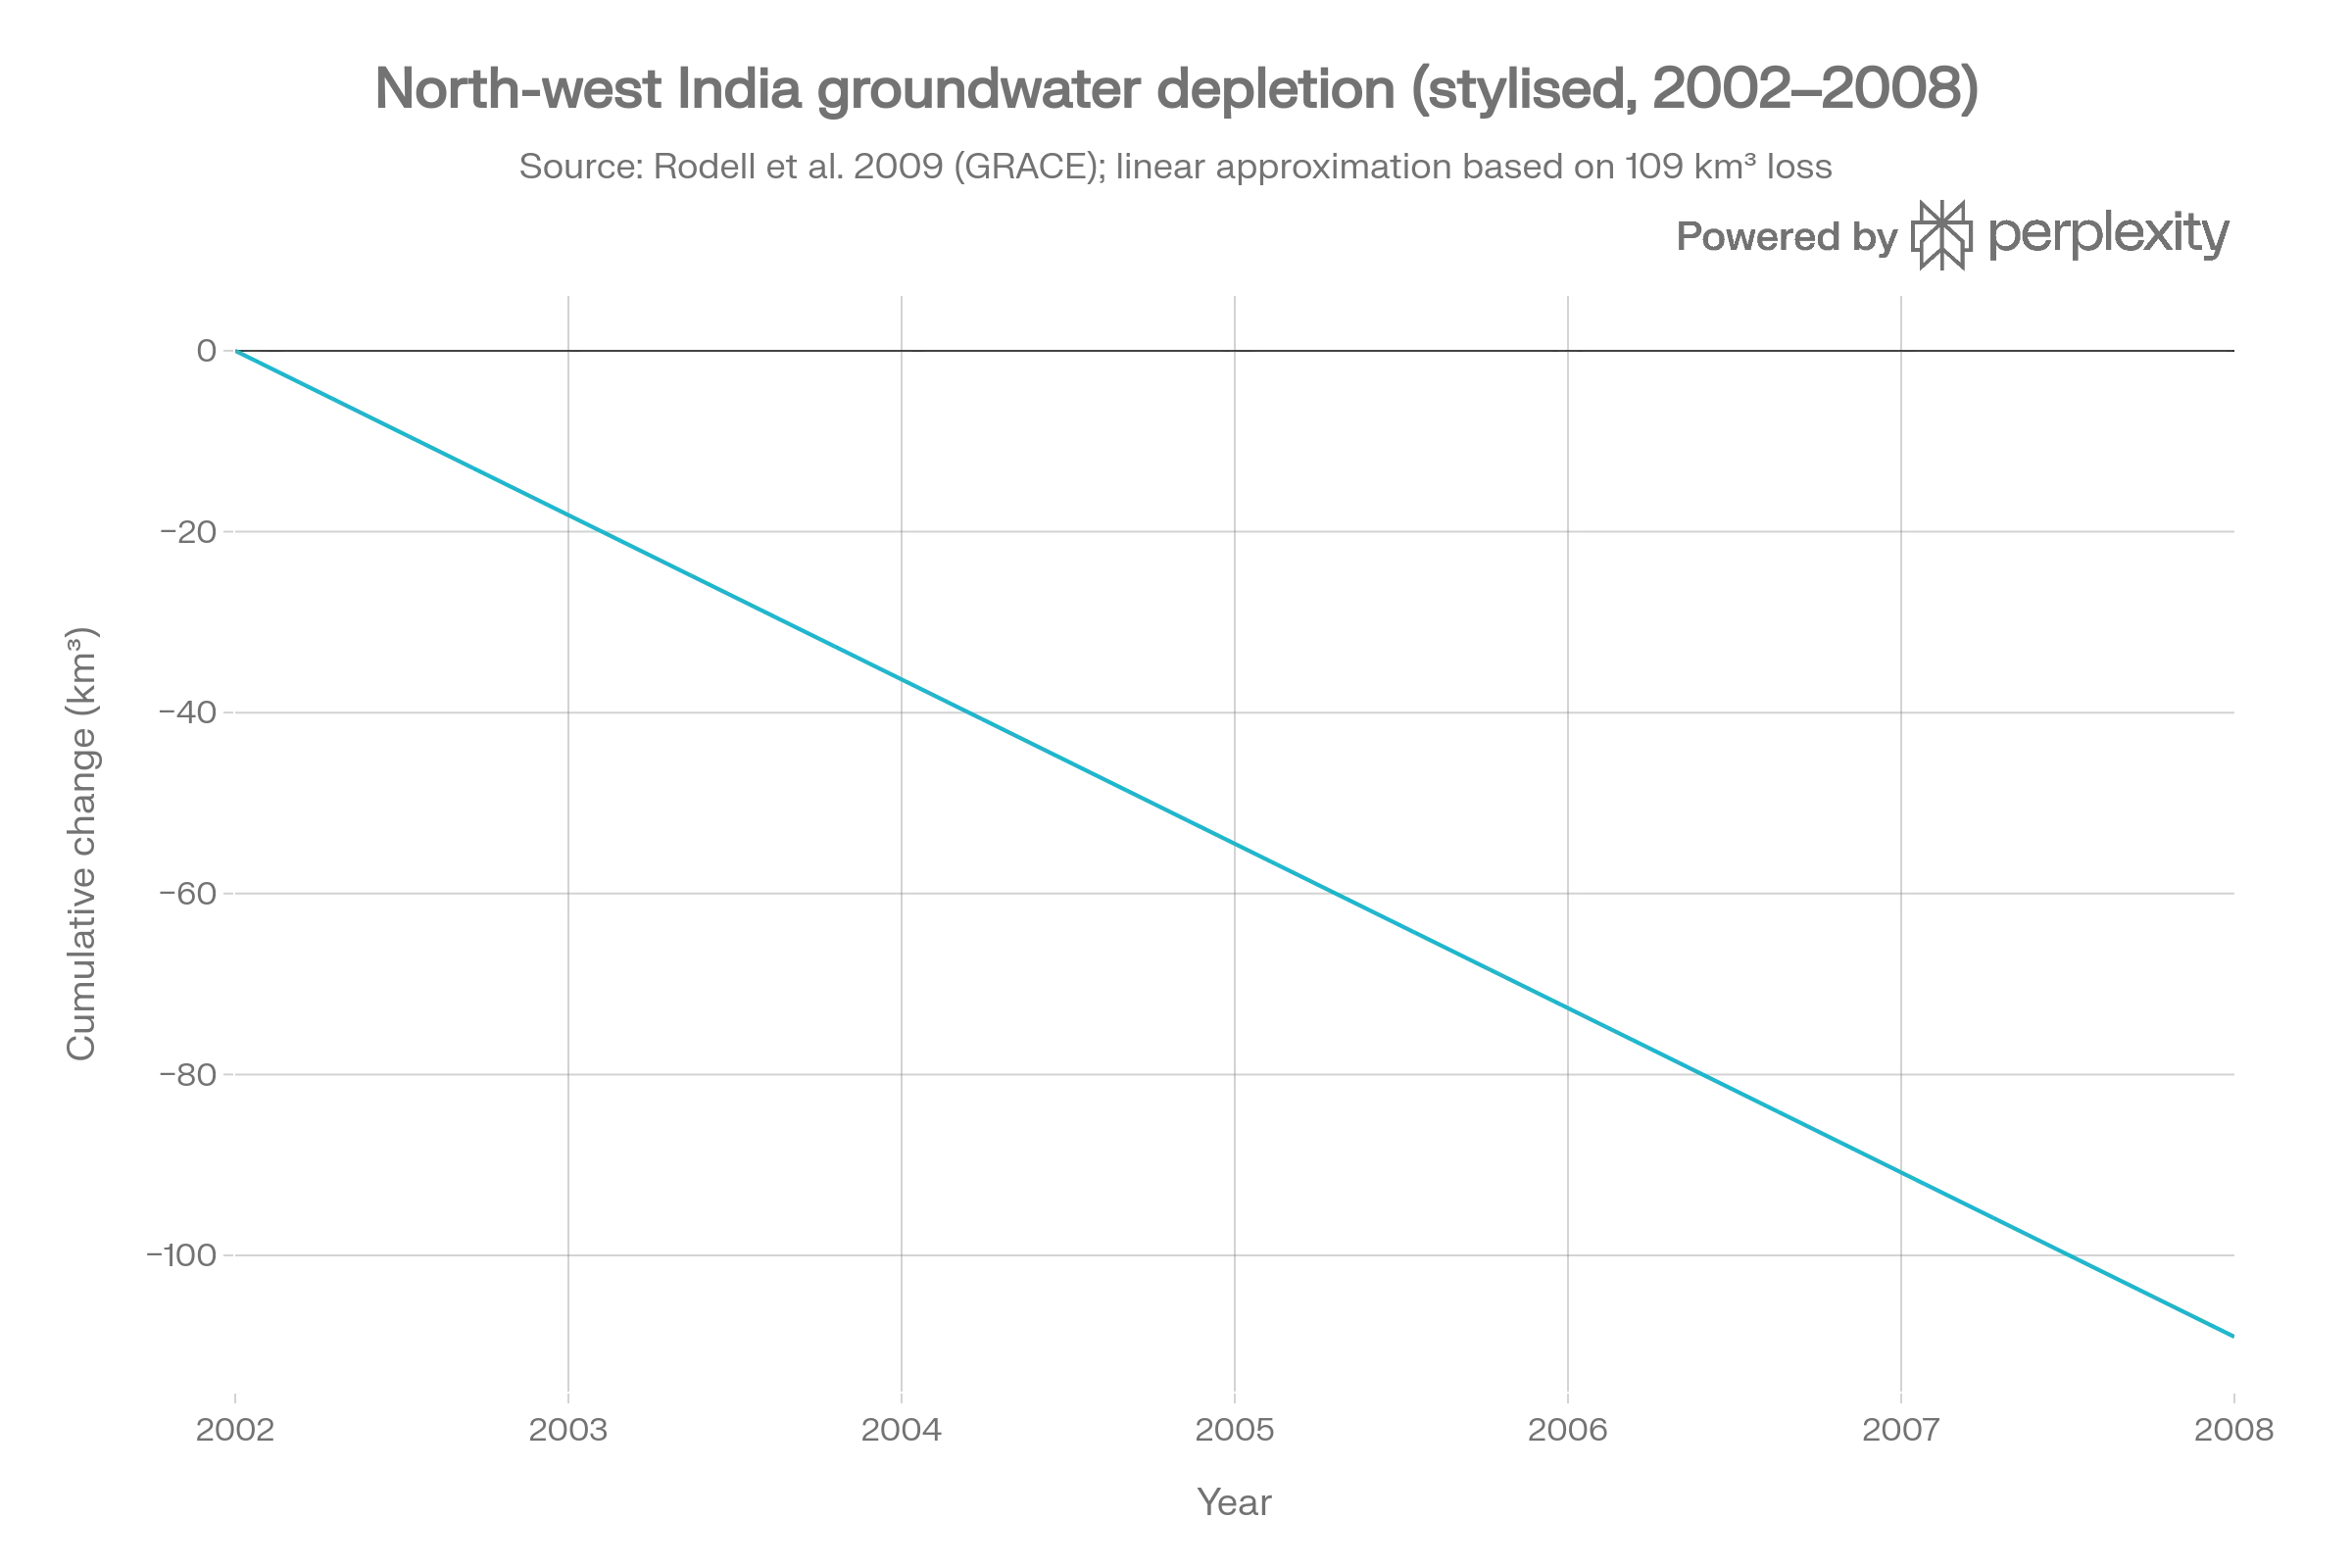
First, agriculture is extremely water intensive across India. Approximately 80–90% of India’s total freshwater withdrawals are allocated for irrigation purposes, compared to roughly one-third in developed OECD economies, locking India’s growth trajectory into a highly water-dependent economic structure. Second, groundwater depletion and over-extraction are accelerating in key agricultural regions. GRACE satellite data reveal cumulative groundwater loss of about 109 km³ in north-west India between 2002 and 2008 (averaging ~18 km³ annually), driven primarily by irrigated agriculture and crop production in Punjab, Haryana, Rajasthan, and Delhi.
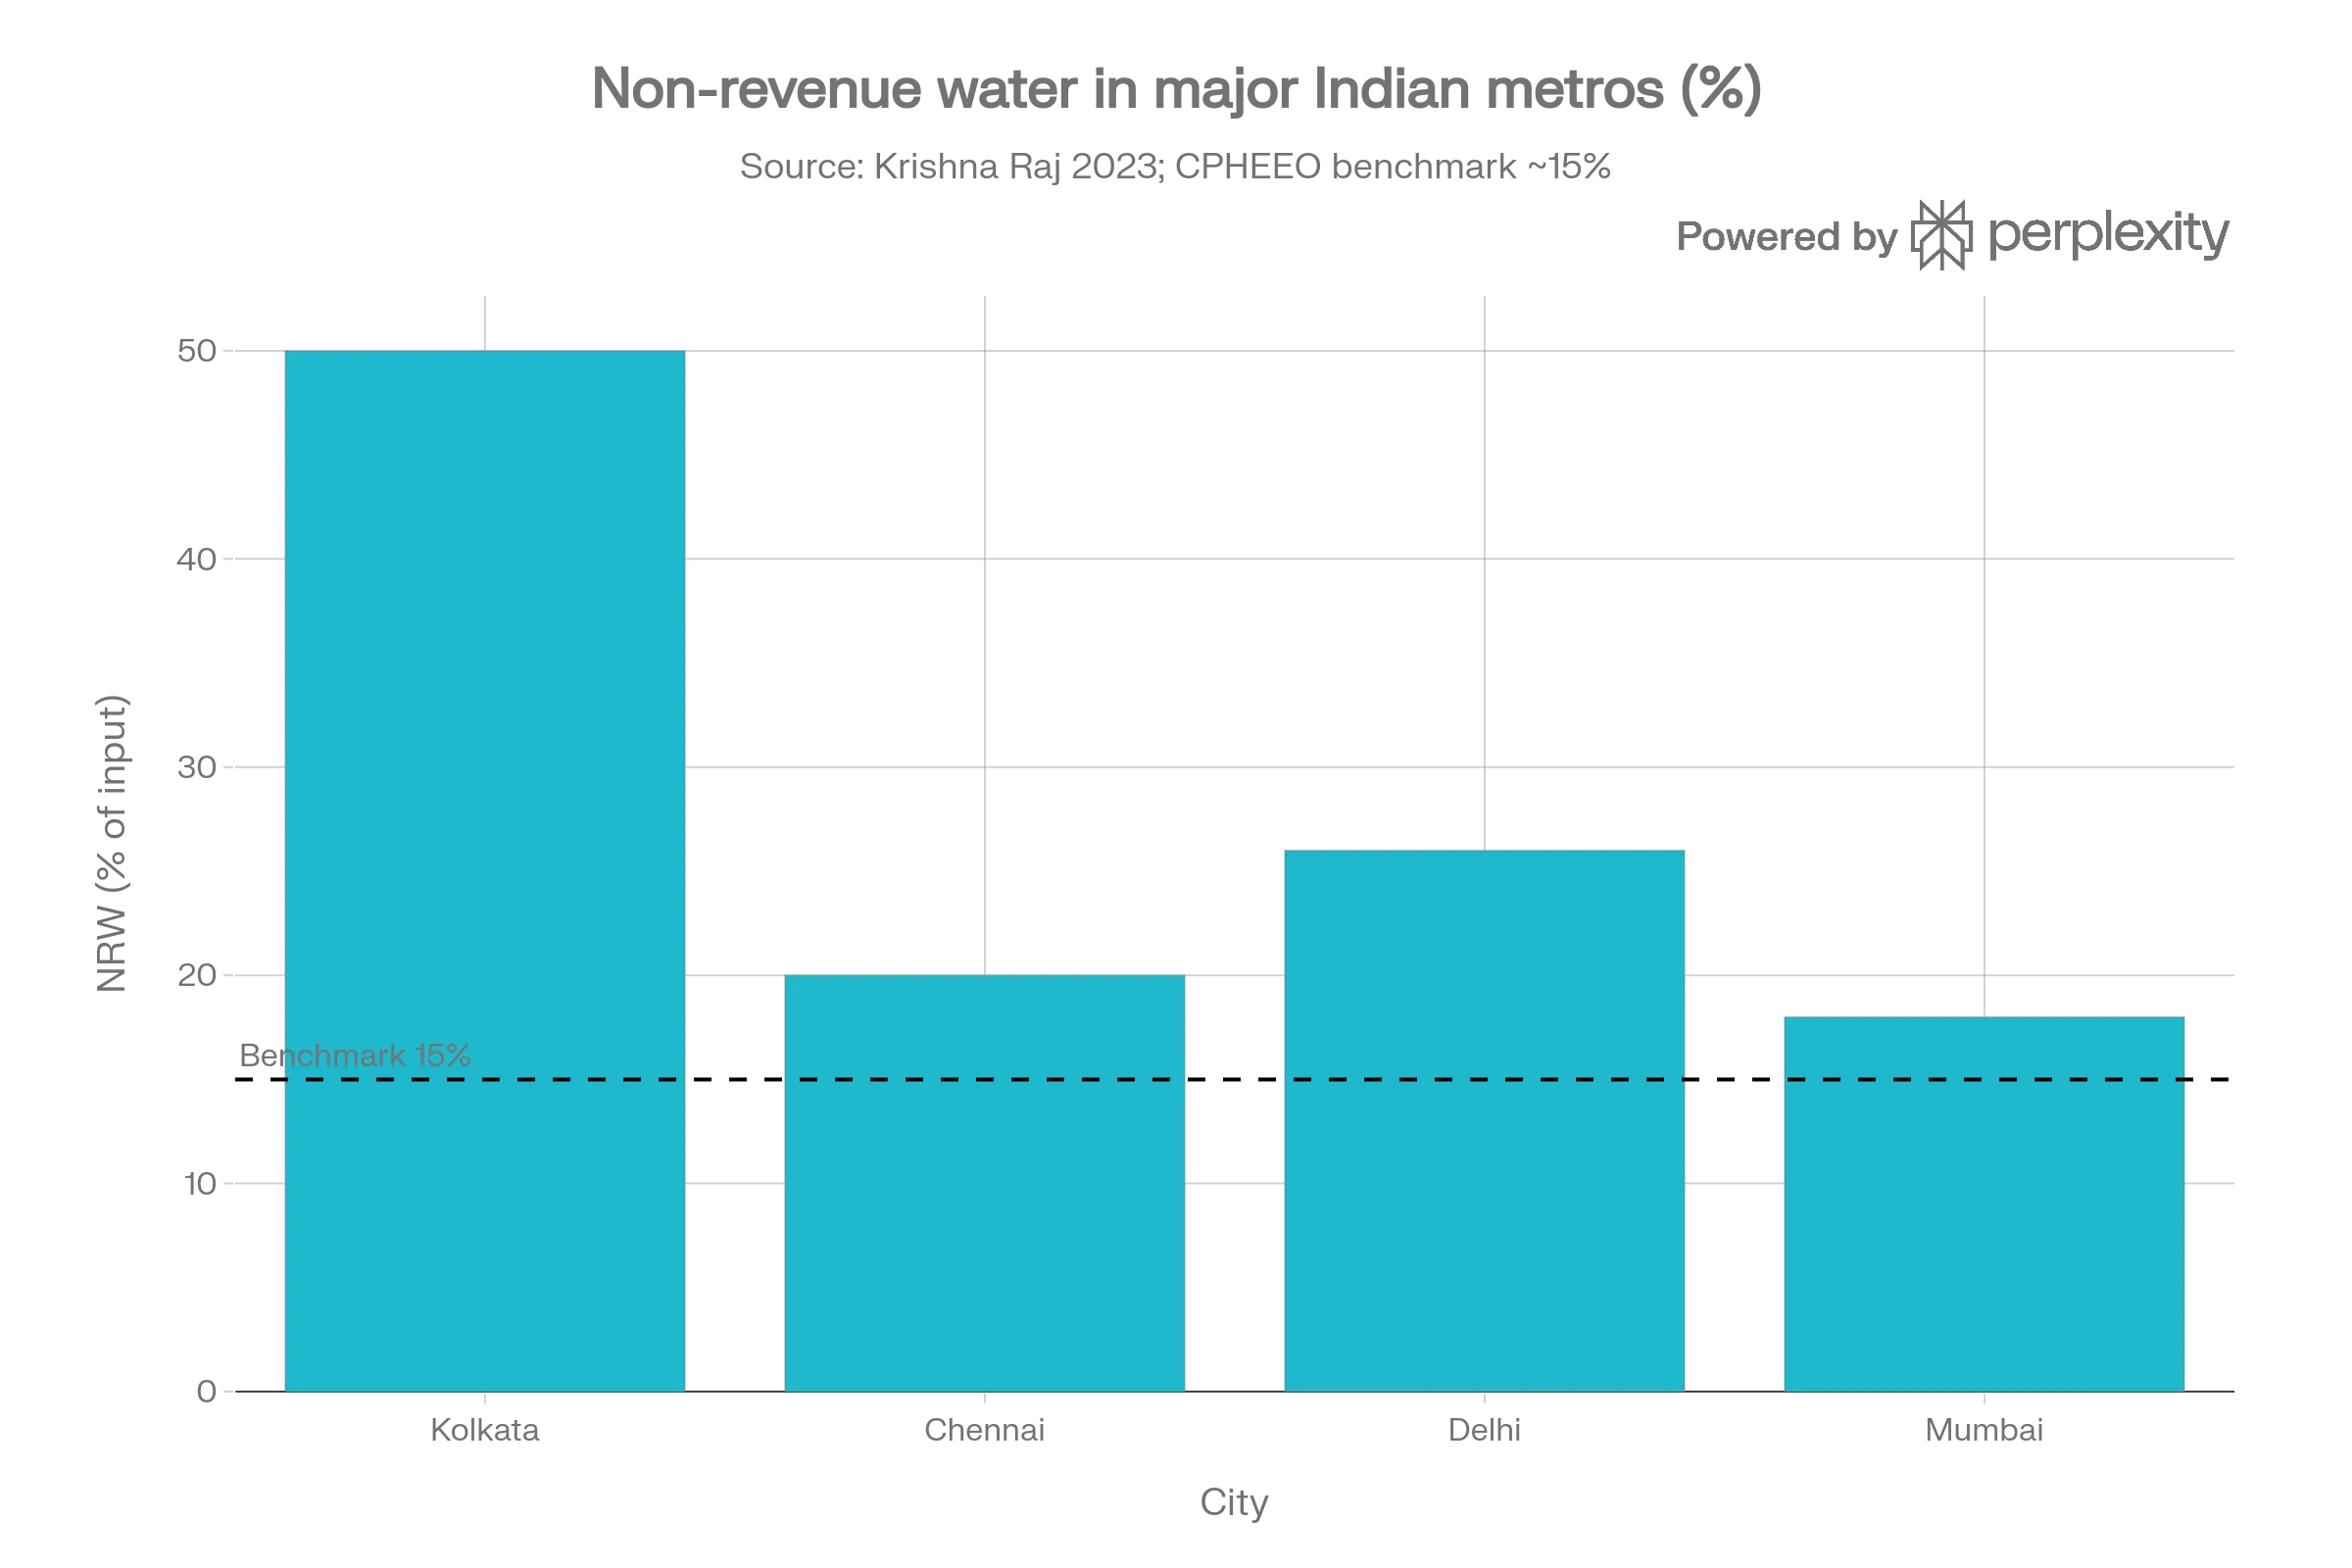
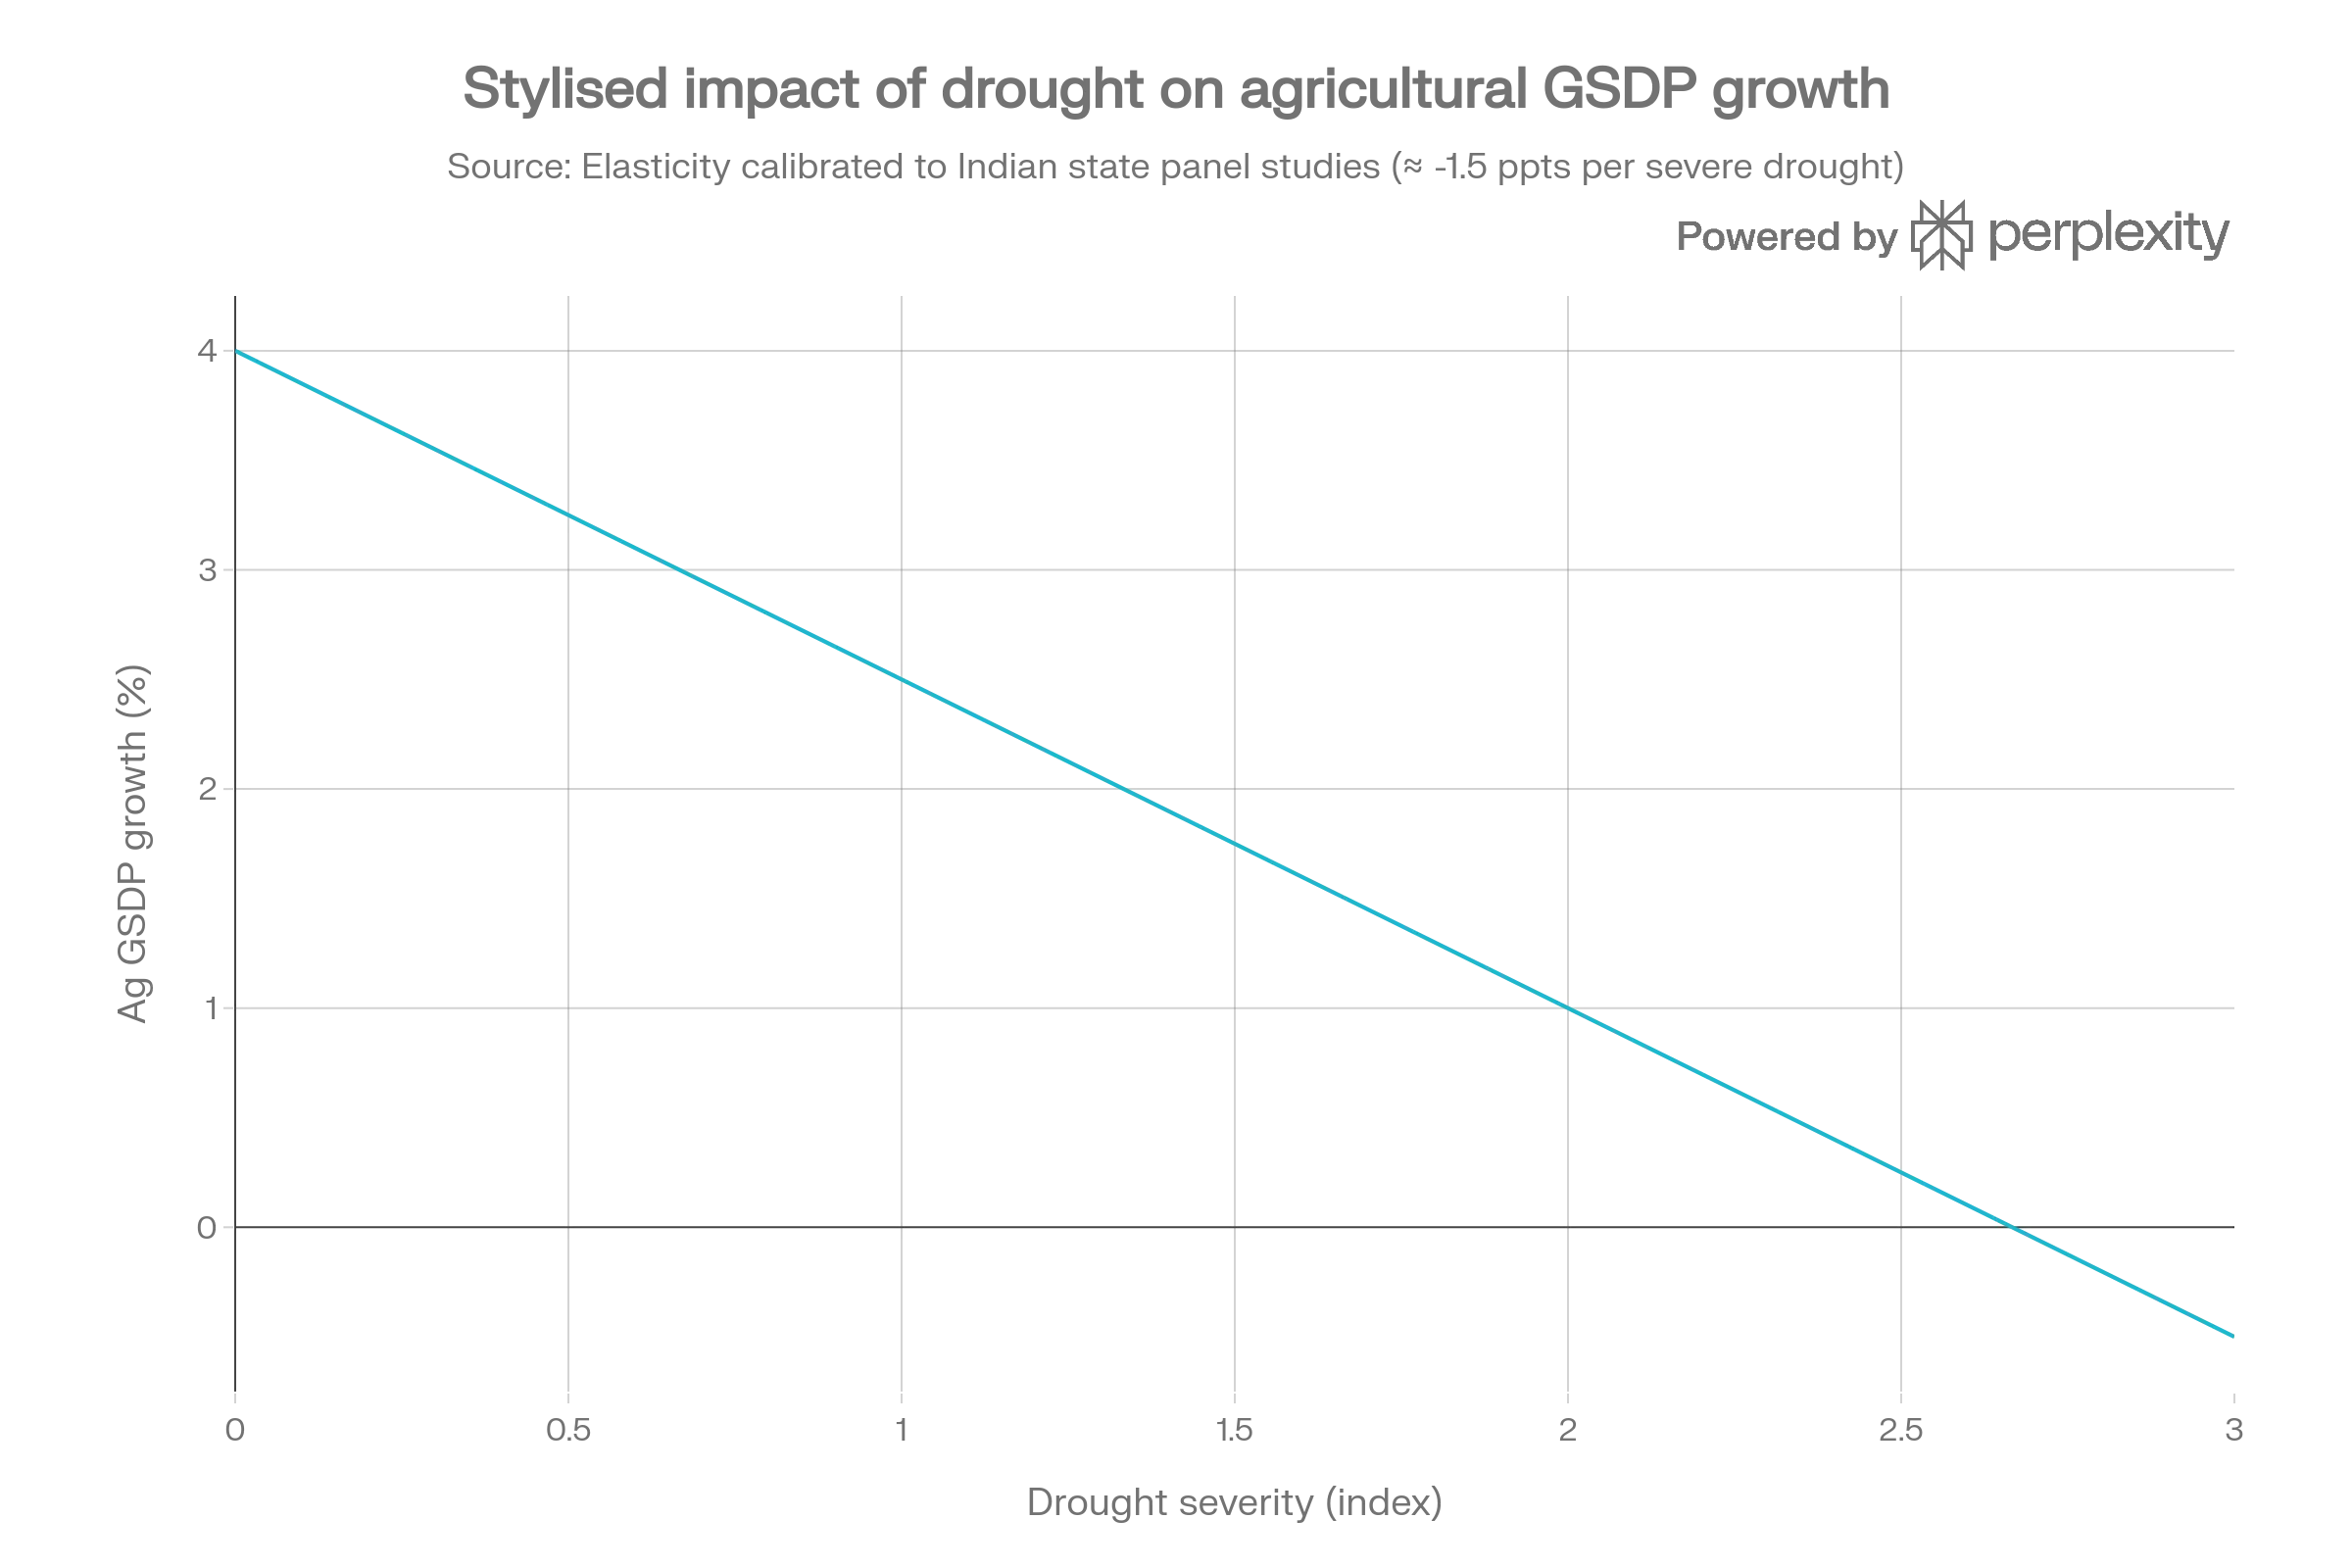
Third, urban water systems and industrial infrastructure experience significant leakage and technical losses. In Bengaluru specifically, unaccounted-for water reaches approximately 509 million litres daily (MLD), while major metropolitan centers including Kolkata, Delhi, Mumbai, and Chennai report non-revenue water (NRW) losses between 18–50% of total supply versus engineering design targets of ~15%, representing critical efficiency failures. Fourth, drought events create persistent downward pressure on state-level economic growth. Multi-year panel studies analyzing Indian states reveal that severe drought years reduce agricultural gross state domestic product (GSDP) growth by approximately 1.5 percentage points on average, with measurable but weaker negative spillover effects on overall state GDP growth and human development indicators.
These are recurring constraints that can be expressed in simple ratios and elasticities, then embedded into growth and investment decisions.
1. Water Intensity of GDP: Measuring Water Dependency as a Structural Growth Constraint
A fundamental metric for analyzing structural water constraints is the water intensity of GDP, which measures total freshwater resource consumption relative to economic output:
India’s sectoral water consumption pattern reveals a structural economic imbalance: agriculture accounts for the dominant share of total freshwater withdrawals despite its shrinking contribution to overall GDP, while industrial and household water use comprises a relatively small proportion. This sectoral composition makes India’s aggregate water intensity exceptionally sensitive to irrigation efficiency improvements and farming practices, rather than to industrial operational efficiency gains or manufacturing optimization.
In many developed high-income OECD member economies, agriculture’s share of total freshwater withdrawals typically ranges from 30–40%, with service sector industries dominating GDP contribution and carrying minimal direct water consumption requirements. India’s persistently delayed structural economic transformation and continued agricultural dependence mean that each additional unit of agricultural GDP growth still carries a substantial embedded water footprint, and the nation’s aggregate water intensity metrics decline only slowly unless irrigation system efficiency improvements accelerate significantly.
2. Irrigated Agriculture, Groundwater Over-Extraction, and Aquifer Depletion in India
At the farm-level and regional scale, a critical metric quantifies agricultural dependence on groundwater extraction:
Central Ground Water Board (CGWB) assessments and peer-reviewed syntheses reveal that in major agricultural states including Punjab and Haryana, this groundwater dependency ratio exceeds 0.8 (80%), with official groundwater development levels exceeding 100% classification, indicating over-exploitation and critical stress categories. GRACE satellite-based hydrogeodetic estimates indicate that north-west India experienced cumulative groundwater depletion of approximately 109 km³ between 2002 and 2008, translating to a mean annual aquifer water-table decline of about 0.33 metres per year across many agricultural locations.
Peer-reviewed scientific research consistently attributes approximately 95% of total freshwater withdrawals in north-west India to irrigated crop cultivation (primarily rice and wheat production), establishing aquifer depletion as fundamentally an irrigated agriculture systems problem rather than a consequence of domestic household consumption or industrial water demand. Extended retrospective analysis estimates that the states of Punjab and Haryana combined depleted approximately 64.6 billion cubic metres (BCM) of cumulative groundwater reserves between 2003 and 2020, demonstrating that aquifer depletion has accelerated and persisted substantially beyond the GRACE satellite monitoring window. The identical water volumes that currently stabilize seasonal cereal production during deficient monsoon rainfall years are simultaneously eroding the subsurface aquifer stocks upon which future agricultural irrigation capacity fundamentally depends.
3. Urban Water Supply Losses, Non-Revenue Water (NRW), and Industrial Water Demand
Urban water supply systems and their operational efficiency can be characterized through two key quantitative equations:
Indian municipal water supply standards and design engineering norms typically establish target specifications of 135–150 litres per capita per day (lpcd) for fully piped and sewered metropolitan areas, with conservatively planned non-revenue water (NRW) targets of approximately 15% for well-operated systems achieving industry best practices.
Empirical field research and water audits conducted in Bengaluru demonstrate that actual per-capita water supply delivery to numerous consumer populations averages closer to 75 litres per day, with quantified unaccounted-for water losses reaching approximately 509 million litres daily and NRW/UFW (unaccounted-for water) percentages ranging from 20–50% across India’s major metropolitan water utilities, including Kolkata (~50% NRW), Chennai (~20% NRW), Delhi (~26% NRW), and Mumbai (~18% NRW). Comprehensive city-level water balance studies spanning Chennai, Bengaluru, Coimbatore, and Delhi collectively demonstrate that available raw-water source volumes initially appear mathematically adequate on technical assessments, but operational reality reveals high transmission leakages, incomplete treatment capacity, and critical distribution infrastructure bottlenecks that combine to create chronic water rationing and heavy dependence on expensive private tanker-truck delivery services.
For manufacturing and industrial operations, this municipal water supply crisis means that incremental capacity expansion projects in highly water-intensive sectors (including thermal power generation, steel production, textile manufacturing, and specialized chemical processing) increasingly must directly compete for constrained municipal water allocations instead of securing access to genuinely supplemental or newly developed water sources. Industrial facility operators therefore face compounding challenges from both absolute volumetric water availability constraints and elevated reliability risk when municipal water authorities operate in continuous structural deficit and rationing mode.
4. Wastewater Treatment, Recycling, Reuse, and Effective Water Availability in Water-Stressed Regions
In chronically water-scarce river basins and regions facing acute water stress, the concept of effective water availability should be recalculated to account for secondary water sources:
Central Pollution Control Board (CPCB) national sewage generation and treatment inventory data reveal that substantial percentages of urban wastewater volumes generated daily from municipal populations remain completely untreated, while even more limited proportions of generated sewage undergo treatment and are subsequently recaptured for beneficial reuse and recycling purposes. This under-utilization pattern implies that most Indian urban centers actively discard large secondary water resources (recycled wastewater) that could potentially substitute for freshwater withdrawals in suitable applications.
Wherever municipal wastewater treatment infrastructure capacity exists and operates reliably, industrial manufacturing parks and adjacent peri-urban agriculture can technically substitute reclaimed and treated municipal wastewater in place of pristine freshwater resource withdrawals, yet current adoption rates remain constrained well below demonstrated technical potential and feasible application volumes. The persistent gap between normative engineering targets for urban water supply (135–150 litres per capita daily) and measured actual per-capita delivery rates (approximately 75 litres per capita daily observed in Bengaluru and comparable shortfalls documented across Chennai and other major cities) reflects a complex combination of constraints including: raw-water source limitations, transmission system leakages, insufficient water treatment facility capacity, and critically under-exploited municipal wastewater recycling and reuse program options rather than representing a single unified “water shortage” problem.
5. Drought Frequency, Agricultural Output Volatility, and Rural Economic Distress in Rain-Fed Agriculture
At the macroeconomic level, drought events and rainfall deficits function as exogenous supply shocks that directly reduce agricultural sector value-added and economic output:
Multi-year longitudinal state-level panel analyses conducted across India’s diverse states conclusively document that severe drought years and monsoon rainfall deficiency events reduce agricultural gross state domestic product (GSDP) expansion rates by approximately 1.5 percentage points on average, with substantially larger negative impacts concentrated in less-irrigated agricultural states and detectable but materially smaller spillover effects reducing overall state GDP growth rates and composite human development indicator metrics. Government of India Economic Survey chapters analyzing agricultural sector performance consistently document this pattern, reliably demonstrating associations between deficient monsoon rainfall and poor growing-season precipitation conditions with accelerated macroeconomic slowdowns affecting overall national GDP growth trajectories and observable spikes in food price inflation affecting consumer purchasing power.
Micro-level field research and qualitative investigation conducted in the chronically drought-stressed regions of Marathwada district directly link persistent drought conditions and inadequate irrigation infrastructure with acute farmer economic distress and suicide mortality. Empirical research reports that approximately 87% of documented farmer suicide cases experienced preceding crop failure events directly attributable to drought conditions and insufficient groundwater irrigation availability, with affected farming households typically operating small, economically non-viable landholdings while carrying elevated debt burdens. Complementary quantitative research analysis reveals that greater than four-fifths of documented farmer suicides occurring across Maharashtra state during the extended period from the mid-1990s through the late 2010s geographically concentrated specifically within Vidarbha and Marathwada regions, both designated as chronically water-stressed agricultural zones characterized by erratic rainfall and inadequate irrigation coverage.
6. Water Resource Constraints as Quantifiable Macro-Level Development Parameters
Integrated analysis of these quantified water security metrics collectively describes an economic system in which national GDP growth acceleration, particularly in agriculture-dependent geographic regions and chronically water-stressed urban metropolitan clusters, encounters material constraints not merely from conventional capital scarcity, labour availability limitations, or technological factors, but fundamentally from absolute volumetric water accessibility constraints and irrigation system efficiency ceilings. Measurable policy and investment levers directly targeting water productivity include: water intensity of GDP metrics tracking trends, groundwater resource extraction dependence ratios by region, municipal non-revenue water loss percentages across urban utilities, municipal wastewater treatment rates and secondary reuse percentages, and empirically-estimated elasticity coefficients measuring agricultural output responsiveness to drought stress and climate volatility.
For policy practitioners, government agencies, and development finance institutions, the analytical transition from descriptive narrative frameworks to data-driven quantitative water resource assessment represents a critical institutional capability. Water security risk enters formal investment appraisal methodologies, government-sponsored state development strategies, and central bank macroeconomic risk assessment frameworks via a clearly-defined and narrowly-bounded set of rigorously trackable mathematical ratios and regionally-segmented water demand parameters. Systematically incorporating water security constraints, groundwater sustainability metrics, and drought-impact elasticities into project-level appraisal documentation, state-level medium-term growth strategy formulation, and macroeconomic risk assessment procedures effectively transforms “water scarcity” from an episodic seasonal headline issue into a recognized and quantified structural parameter deeply embedded within India’s long-term sustainable development model and economic growth potential.
References & Sources
- 1. FAO AQUASTAT – India View SourceFAO. AQUASTAT country profile – India.
- 2. World Development Indicators – Water View SourceWorld Bank. World Development Indicators – freshwater withdrawals and resources.
- 3. Dynamic Ground Water Resources of India View SourceCentral Ground Water Board. Dynamic Ground Water Resources of India (multiple assessment years).
- 4. Groundwater depletion in India from GRACE View SourceRodell, M. et al. (2009). Satellite-based estimates of groundwater depletion in India. Geophys. Res. Lett.
- 5. Where All the Water Has Gone? Unreliable Water Supply in Bengaluru View SourceKrishna Raj, R. (2023). Where All the Water Has Gone? ISEC Working Paper 307.
- 6. Creating Urban Water Resilience in India View SourceWRI India et al. (2020). Creating urban water resilience in India.
- 7. Nexus of Drought, Relief Finances, and Economic Growth View SourceRathore, U. et al. (2024). Nexus of Drought, Relief Finances, and Economic Growth: Evidence from Indian States.
- 8. How do floods and drought impact economic growth… View SourceAmarasinghe, U. et al. (2020). How do floods and drought impact economic growth and human development at the sub-national level in India?
- 9. Farmers Suicides in Marathwada Region of India View SourceVenkateswarlu, B. et al. (2019). Farmers Suicides in Marathwada Region of India.